Table of Contents
I’ve worked with a few LLM apps where everything looks fine… right up until you start getting weird output, slow responses, or inconsistent quality. That’s usually when you realize you don’t actually have great visibility into what’s happening under the hood. If that sounds familiar, you’ll probably like Langtrace AI.
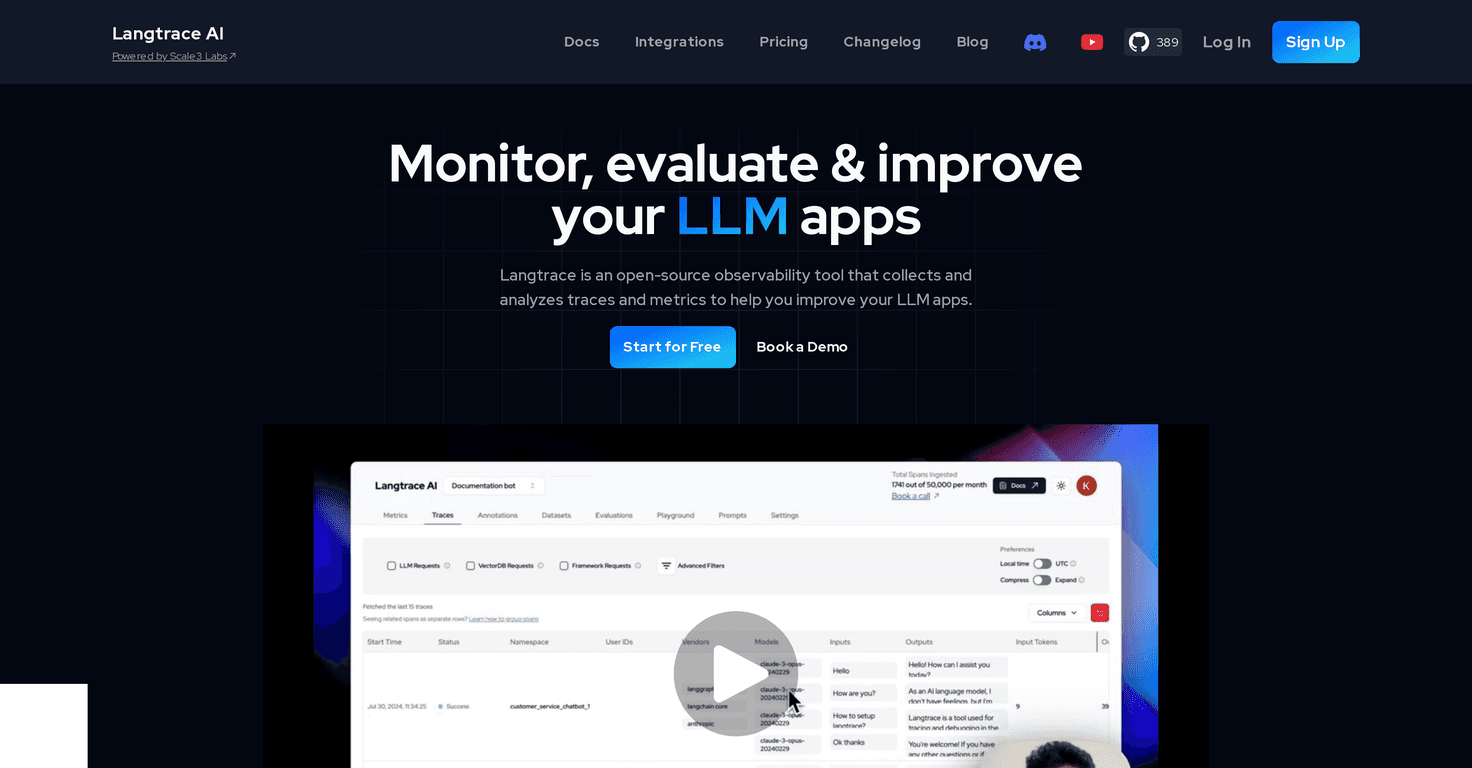
Langtrace is an open-source observability tool for language model applications. The pitch is simple: instrument your system, trace what’s going on end-to-end, and use the data to improve performance over time. In my experience, the big win isn’t just “logging more.” It’s that you can actually connect model behavior back to the pipeline steps that likely caused it.

What I noticed right away is how quickly you can get started. Setup isn’t buried in a maze of config files, and you don’t need to rewrite your whole app to see value. You can integrate it with a relatively small amount of code, then iterate from there.
Langtrace also focuses on end-to-end observability across the ML pipeline. Instead of only looking at final responses, it helps you trace requests through the different components, spot bottlenecks, and build feedback loops. That’s the part I care about most—because without feedback loops, “monitoring” can turn into endless dashboards with no action.
On top of that, it includes built-in evaluations (heuristic, statistical, and model-based). In practice, that means you’re not stuck doing everything manually. You can run evaluations to understand quality changes, regression issues, and overall performance trends as you update prompts, retrieval, or model settings. And yes, it supports common frameworks and vector databases, so it’s not locked into one specific stack.
One more thing: SOC 2 Type II certification is mentioned as part of their security posture. I’m not saying you’ll never need to worry about data handling, but it’s reassuring—especially if you’re working with anything sensitive or regulated.
Langtrace AI Review
If you’re building with LLMs, you already know quality isn’t static. Prompts evolve. Retrieval changes. Models get swapped. Even “small” updates can create noticeable differences. That’s why observability matters. Langtrace helps you see what happened, not just what you got.
Here’s what I’d highlight as the practical value: when something goes wrong, you don’t have to guess. You can trace the request, check where the time went, and compare evaluations across runs. That makes debugging faster and iteration less stressful.
And if you’re building a feedback loop for continuous improvement, Langtrace gives you the building blocks to do it systematically—rather than relying on ad-hoc reviews and gut feelings.
Key Features I Actually Look For
- SOC 2 Type II security: Helps with trust and governance when you’re handling real user data.
- Supports popular LLMs, frameworks, and vector databases: You shouldn’t have to force your architecture to fit the tool.
- Non-intrusive setup: You can instrument without turning your codebase into a refactor project.
- End-to-end observability: Trace requests across the ML pipeline, not just the final model output.
- Feedback loop creation: Turn evaluations into an improvement cycle you can repeat.
- Built-in evaluations: Heuristic, statistical, and model-based checks.
- Trace + bottleneck detection: Helps you find where latency or quality issues are coming from.
- Manual request evaluation: Useful for creating golden datasets and labeling examples you care about.
What this looks like in a real workflow
Let’s say you update a prompt and suddenly your “helpfulness” score drops. With a tool like this, you can compare traces and evaluations before and after the change. If retrieval quality is degrading, you can often spot it in the pipeline rather than blaming the model alone.
Or maybe you notice latency spikes only on certain requests. Tracing helps you identify whether it’s the model call, a retrieval step, or another part of the pipeline. That’s the difference between “it feels slower” and “here’s the bottleneck.”
Pros and Cons (No Sugarcoating)
Pros
- Solid monitoring and evaluation for LLM apps: It’s not just capturing data—it also helps you evaluate and compare outcomes.
- Open-source and self-hostable: If you don’t want vendor lock-in, this matters.
- Integration feels straightforward: You can get visibility without going “all in” on a rewrite.
- Security posture is a plus: SOC 2 Type II is a real credibility signal for teams with compliance needs.
- Supports continuous improvement: The feedback loop concept is practical, not just marketing.
Cons
- You may need technical chops to get the most out of it: If you’re not comfortable with instrumentation/evaluations, you might not realize the full benefit right away.
- Support may not be as responsive as commercial tools: That’s common with open-source, and it can slow you down if you hit a weird edge case.
Pricing Plans (What You Need to Know)
Langtrace offers a free sign-up option, which is great if you just want to test drive the observability workflow before committing. For exact pricing details beyond the free tier, you’ll likely need to check their demo/pricing page or contact their team. I prefer this approach anyway—because with observability tooling, the real cost often depends on how much traffic you’re monitoring and how you’re running evaluations.
Wrap up
Overall, I think Langtrace is one of the more useful observability options for teams working with large language models. The combination of end-to-end tracing, built-in evaluations, and the ability to build feedback loops is exactly what you want if you’re serious about improving quality over time.
Yes, you’ll probably need a bit of technical comfort to set things up the way you want. But if you’re already iterating on prompts, retrieval, or model choices, the visibility you get from Langtrace can save you hours of guessing.
If you’re working with LLMs and you don’t have strong observability yet, it’s worth giving Langtrace a shot.
Promote Langtrace AI