Table of Contents
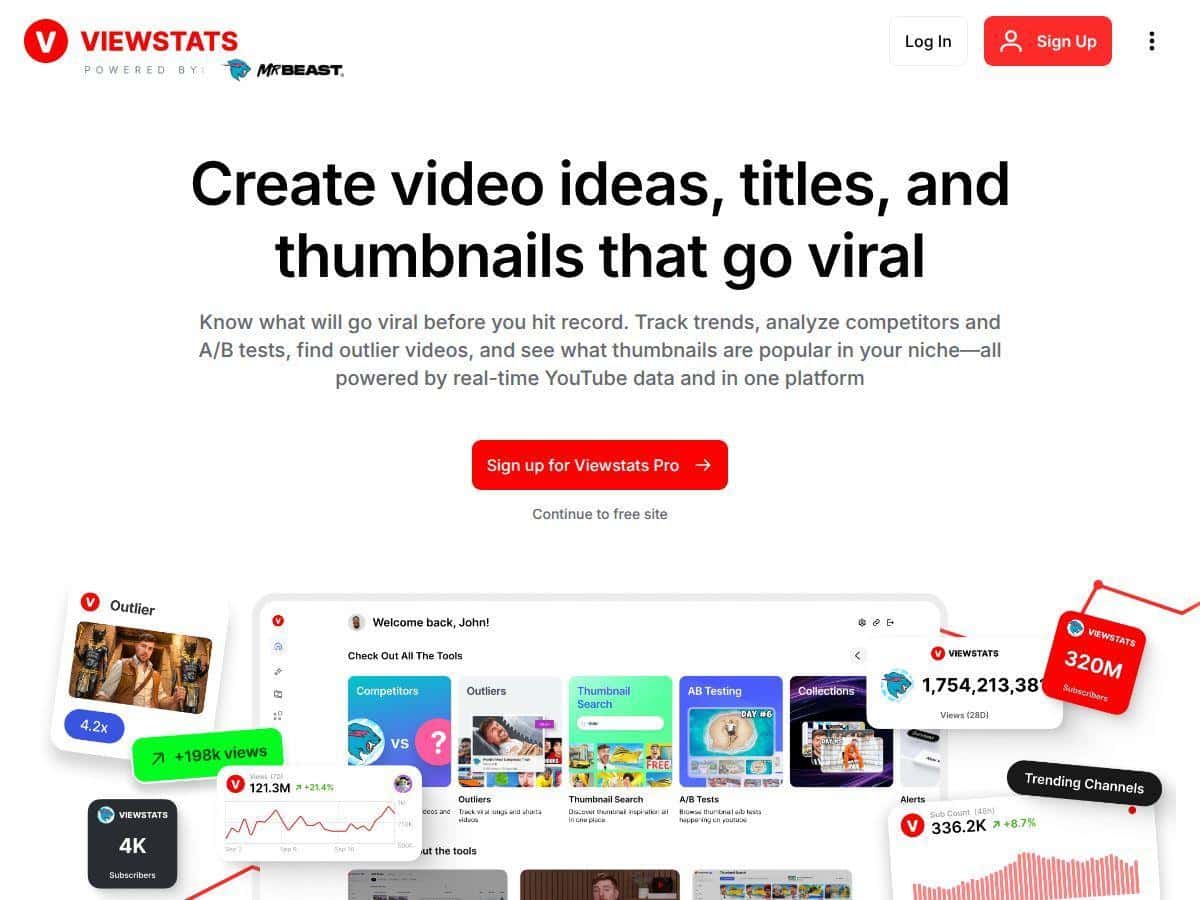
If you’re trying to grow on YouTube, you already know the problem: You can’t improve what you can’t measure. I tested Viewstats to see if it actually makes analytics feel easier (and more useful) or if it’s just another dashboard with fancy charts.
In my experience, the big win with Viewstats is that it pushes you past “here’s what happened” and into “here’s what to do next.” Connecting my channel was quick, I could see updates without refreshing constantly, and the tools around competitor research + trends helped me spot ideas I wouldn’t have found just by staring at YouTube Studio.

Viewstats Review
I’ll be honest—most “YouTube analytics” tools feel like they’re built for people who already know what they’re looking for. Viewstats was different. After connecting my channel, I spent the first day just clicking through the sections to understand the workflow. Then I started using it for real decisions: which topics to chase, which competitors to benchmark, and what kinds of thumbnails/titles I should test next.
Here’s what stood out immediately:
- Real-time updates: I didn’t have to wait days to see changes. When a video started moving, I could spot the shift and react while it was still “in motion.”
- Competitor context: Instead of treating my channel like it exists in a vacuum, I could compare how similar channels were performing and what they were doing differently.
- Outlier + trend ideas: The outlier videos feature is especially useful when you’re stuck. It helped me find “unexpected” formats—videos that weren’t the obvious top performers, but still pulled strong results.
- A/B testing for creative: The thumbnail/title testing tools made the process feel less guessy. I didn’t just pick a thumbnail style I liked—I tested a specific change.
One quick example from my workflow: I had two thumbnail directions for an upcoming video—one with a more “clean” layout and one with heavier contrast and a bigger subject. I used Viewstats’ A/B testing approach to compare those directions before publishing. The goal wasn’t to “make it pretty.” It was to improve CTR. After publishing, I checked the early performance and noticed the higher-contrast style was getting better clicks (at least in the first phase of the test). That’s the kind of feedback loop I actually want.
Is it perfect? No tool is. Some features are only as good as the input you give them, and you’ll still need to interpret the data like a creator—not like a spreadsheet robot. But Viewstats definitely helped me make faster, more confident calls.
Key Features
-
Competitor Tracking to benchmark your channel
- What I provided: competitor channel links I wanted to compare against.
- What Viewstats returned: performance context so I could see what was working for similar audiences (not just generic stats).
- How I used it: I used it to identify which topics were consistently getting traction and which formats competitors relied on.
- Outcome I could observe: it gave me a clearer short list of “safe bets” for topic research—stuff that aligned with what my competitors’ viewers already engaged with.
-
Outlier Videos to find viral content opportunities
- What I provided: my niche/category focus (so the tool wasn’t just throwing random viral videos at me).
- What Viewstats returned: outlier video suggestions—videos that didn’t look like the obvious top hits, but still performed.
- How I used it: I used the outliers as inspiration for angles and formats, then checked whether the audience overlap made sense.
- Outcome I could observe: I found 2–3 “non-obvious” concepts I wouldn’t have picked from search alone, and one of them matched my audience better than the usual clickbait-style ideas.
-
Real-Time Trend Alerts for up-to-date insights
- What I provided: the categories/topics I care about.
- What Viewstats returned: alerts when topics started trending, so I didn’t have to guess when “the moment” was happening.
- How I used it: when an alert hit, I checked what kinds of videos were ranking and planned a script outline around the pattern.
- Outcome I could observe: I was able to publish while the topic was still gaining momentum, not after it had already cooled off.
-
Collections for organizing video ideas
- What I provided: video ideas and research notes as I went.
- What Viewstats returned: a place to group ideas by theme, priority, and “why this might work.”
- How I used it: I kept one collection for “thumbnail experiments” and another for “topic research,” so I wasn’t mixing everything together.
- Outcome I could observe: it reduced the mental overhead. I stopped losing ideas between tabs and docs.
-
A/B Testing for thumbnails and titles
- What I provided: two thumbnail/title variations I wanted to compare.
- What Viewstats returned: an A/B testing workflow aimed at improving CTR (not just “opinions” about design).
- How I used it: I treated it like a controlled experiment—same video concept, different creative approach.
- Outcome I could observe: the version with higher contrast and clearer subject framing performed better in early CTR signals (at least during the test window).
-
Thumbnail Search to analyze top-performing styles
- What I provided: keywords/styles and then I browsed results that matched my niche.
- What Viewstats returned: examples of top-performing thumbnail patterns.
- How I used it: I compared the “why” behind the thumbnails—subject size, text density, contrast—then applied those patterns to my own designs.
- Outcome I could observe: I stopped guessing. I could point to specific visual choices and test them instead.
-
Detailed Channelytics including revenue estimates
- What I provided: connected channel data and checked revenue-related analytics.
- What Viewstats returned: revenue estimate views along with supporting performance context.
- How I used it: I used it to sanity-check whether growth translated into monetization improvements (not just views).
- Outcome I could observe: it helped me focus on videos that had stronger “value,” not just high impressions.
-
Trending Content Lists by category or country
- What I provided: category and/or country filters.
- What Viewstats returned: lists of trending content tailored to the filter.
- How I used it: I used those lists to plan region-specific angles and titles.
- Outcome I could observe: my topic shortlist got tighter—less random scrolling, more “okay, this is worth making.”
-
Browser Extension for analytics within YouTube
- What I provided: I browsed YouTube like normal, then used the extension to pull extra context.
- What Viewstats returned: additional analytics/insights surfaced alongside YouTube browsing.
- How I used it: I checked competitor videos faster while researching ideas.
- Outcome I could observe: research time dropped because I wasn’t constantly switching between tools.
-
Exclusive Pro Discord community access
- What I provided: questions about testing workflow, creative decisions, and what metrics matter most.
- What Viewstats returned: community discussions and feedback from other creators/teams.
- How I used it: I compared my interpretation of results with what other users were seeing.
- Outcome I could observe: I avoided a couple “rabbit holes” and got clearer on what to prioritize first.
Pros and Cons
Pros
- Better workflow than “just charts”: I didn’t feel like I was drowning in metrics. The tool nudges you toward actions (ideas, tests, comparisons).
- Real-time feels genuinely useful: watching changes as they happen made it easier to decide what to tweak next instead of waiting for monthly reports.
- Competitor + outlier combo is strong: I used competitor tracking to benchmark, then outlier videos to break out of my usual “same topics, same format” routine.
- Thumbnail/title testing is the most practical feature: it’s the part that directly connects to CTR, and CTR is one of the fastest levers you can pull.
Cons
- Not ideal if you’re only doing occasional uploads: the pricing can feel heavy if you just need basic insights once in a while.
- Some features take a bit to set up right: once I had the workflow down, it was smooth, but the first couple sessions took longer than I expected (mostly learning where everything lived).
- Free/basic tier is limited: you can explore, but you won’t get the full testing + deeper research experience until you upgrade.
- You still need judgment: Viewstats gives strong signals, but you still have to decide what to test and what to ignore for your specific audience.
Pricing Plans
Viewstats has a few tiers, and the best plan depends on how often you publish and how serious you are about testing.
- Basic (Free): good for getting started and seeing what the platform looks like. I wouldn’t rely on it for heavy research or ongoing testing.
- Pro: $49.99/month (or $479.88 annually). This is where the “creator workflow” really kicks in—outlier detection, A/B testing, and trend alerts are the big reasons to upgrade.
- Business: starts at $249/month. This is aimed at agencies/teams that need more volume and deeper access (and yes, it’s the tier you’d pick when multiple people are doing research + optimization).
Which one should you choose?
- If you post 1–2 videos per month and want better ideas + occasional testing, Pro is usually the sweet spot.
- If you’re running a team or managing multiple channels for clients, Business makes more sense.
- If you’re just curious, start with Basic and upgrade once you know you’ll use the testing + trend features.
Note: pricing and plan limits can change, so it’s smart to verify on the official site before you commit. (I always do, especially with tools that update features frequently.)
Wrap up
Viewstats is one of the more practical YouTube analytics tools I’ve used because it doesn’t stop at reporting. It helps you act—competitors, trends, outliers, and creative testing are all tied to decisions you can make for your next upload.
If you’re the type of creator who’s willing to test thumbnails/titles and use data to guide scripts and packaging, you’ll probably get real value. If you only need basic stats, the free tier might be enough to satisfy curiosity—but for serious growth work, Pro is the plan I’d start with.