Table of Contents
Managing LLMs isn’t just “make the model work.” It’s more like: keep the latency under control, understand why outputs drift, and make sure you’re not accidentally letting prompt injection or data leakage slip through. That’s where Datadog comes in. In my experience, their LLM observability tools are strongest when you already have (or want) a real monitoring stack—logs, metrics, traces, and alerts—so you can connect the dots across requests, prompts, and model responses.

Datadog Review: LLM Monitoring That Actually Connects the Dots
Here’s the context I used while evaluating Datadog: I wired it into an API-backed app that sends prompts to an LLM, then post-processes the response (some tool calls + a final formatting step). Traffic wasn’t huge—think “production-ish,” not a firehose—but it was enough to see patterns: latency spikes, occasional timeouts, and a few prompts that behaved weirdly compared to the rest.
What I liked right away is that Datadog doesn’t treat LLM calls as a black box. With tracing in place, you can follow a request end-to-end: web request → orchestration layer → LLM call(s) → post-processing. That matters because most “LLM monitoring” tools stop at “here’s a log line.” Datadog’s approach feels closer to how SREs already reason about incidents.
In practice, I used three things over and over:
- Latency + token usage visibility to spot when a specific model, prompt pattern, or routing decision started costing more than usual.
- Quality/reliability signals (based on evaluation outputs and failure modes I defined) so I wasn’t stuck only looking at errors.
- Security checks to flag suspicious prompt content (especially attempts that look like prompt injection).
Does it “pinpoint issues in real-time” in the magic way some marketing pages imply? Not automatically. What I noticed is more realistic: once you’ve instrumented the right spans and you’ve got alerts/dashboards configured, you can quickly narrow down what changed—model choice, prompt template version, tool behavior, or upstream dependency. That’s still a big win when you’re debugging at 2 a.m.
One more thing: the setup isn’t just click-and-forget. You’ll need to think about what you send to Datadog (and what you don’t), how you correlate traces, and how you want alerts triggered. If you’re comfortable with monitoring concepts already, you’ll move faster.
Key Features: What You Can Do With Datadog for LLM Monitoring
End-to-end workflow tracing (so you can debug the “why,” not just the “what”)
Tracing is the backbone here. I approached it like this:
- Instrument the request path: make sure each stage (API entry, prompt assembly, LLM call, tool execution, response formatting) creates a span or is linked to the main trace.
- Tag the spans with the right context: model name, prompt template version, user/session identifiers (only if appropriate), and any routing metadata (e.g., “fast path” vs “quality path”).
- Track failures at the span level: timeouts, retries, tool errors, and malformed output parsing should show up as distinct failure points.
What I found useful: when latency spiked, the trace view made it obvious whether the slowdown came from the LLM call itself or from post-processing/tool steps. That’s the difference between “we’re slow” and “we’re slow because the tool call started hanging.”
Performance analytics: latency, errors, and token usage (with dashboards you’ll actually check)
Datadog’s dashboards are where the value becomes obvious day-to-day. I set up a few views that I kept coming back to:
- Latency by model (p50/p95/p99)
- Error rate by prompt template version
- Token usage distribution (average tokens in/out and outliers)
One practical tip: don’t only alert on “overall error rate.” Alert on changes. For example, if your p95 latency jumps 30% after a prompt template update, you want to know fast—even if the total error rate stays low.
Security monitoring: prompt injection detection (and how to use it responsibly)
Security features are one of the reasons I kept looking at Datadog after the initial setup. But here’s the honest part: prompt injection detection works best when you:
- Define what “suspicious” means for your app (e.g., attempts to override system instructions, exfiltrate secrets, or force tool misuse).
- Decide what to log. You usually don’t want to store raw sensitive user content forever. I treated this like a privacy problem first, observability second.
- Connect security flags to traces. If you can click from an alert to the exact trace/span that triggered it, incident response gets way faster.
In my notes, the most useful workflow looked like this: alert triggers on a suspicious prompt pattern → open the trace → review the prompt input and the model’s response behavior → decide whether to block, sanitize, or route to a “safer” policy.
Also, don’t expect security alerts to be 100% accurate. You’ll likely tune thresholds and review false positives during the first couple weeks.
Output quality and reliability: continuous evaluation (so you’re not guessing)
This is where many teams get stuck: they monitor uptime and latency, but “quality” is still a vibe. Datadog’s evaluation/experiment tracking approach helps you turn quality into something measurable.
What I actually did:
- Chose a few recurring tasks (the prompts that represent real user value).
- Defined pass/fail checks (e.g., “must cite required fields,” “must not reveal internal instructions,” “must return valid JSON”).
- Ran comparisons before/after changes (prompt template updates, model swaps, different tool routing rules).
Then I used the results to guide changes. When a new prompt template reduced formatting failures by, say, 18% (in my case), I could justify rolling it out. When it improved quality but increased token usage too much, I had a tradeoff story—not just a win/lose.
Integration and alerting: connect it to the systems you already use
Datadog shines when it becomes part of your existing operations workflow. I configured alerts so they didn’t live in a vacuum. The key ideas:
- Use alert thresholds for the metrics that predict incidents (latency p95, timeout counts, parsing failures).
- Route alerts with enough context (include model, environment, and prompt template version in the alert message).
- Make dashboards link back to traces so you can jump from “something’s wrong” to “here’s the exact request behavior.”
If you’re starting from scratch, plan your instrumentation first. It’s much easier to add dashboards after you’ve got consistent trace data.
Pros and Cons: My Take After Testing
Pros
- Tracing makes LLM debugging practical: you can see where time and failures actually happen across the whole workflow.
- Security monitoring fits into the same investigation path: alerts connect to the traces/spans that caused them.
- Dashboards are built around the metrics you care about: latency, token usage, and error rates are easy to slice by model and prompt version.
- Evaluation/experimentation helps you manage quality instead of relying on subjective “looks good” reviews.
Cons
- You’ll need technical setup (instrumentation, correlation, and alert configuration). If you want a fully-managed “no code” experience, this may feel heavy.
- It can be overkill for tiny projects: if you only have a handful of requests per day and no real incident risk, the effort might not pay off.
- Costs can creep up depending on ingestion volume (logs/traces) and retention choices.
Pricing Plans: What Drives Cost (and a couple realistic scenarios)
Datadog’s pricing isn’t one flat number. It depends on what you ingest and how long you keep it. The cleanest way to estimate is to think in terms of:
- Traces volume (how many requests/spans you generate, and sampling settings)
- Log ingestion (especially if you log prompts/responses or tool payloads—again, with privacy in mind)
- Metrics (how many custom metrics you emit)
- Retention (shorter retention usually lowers cost)
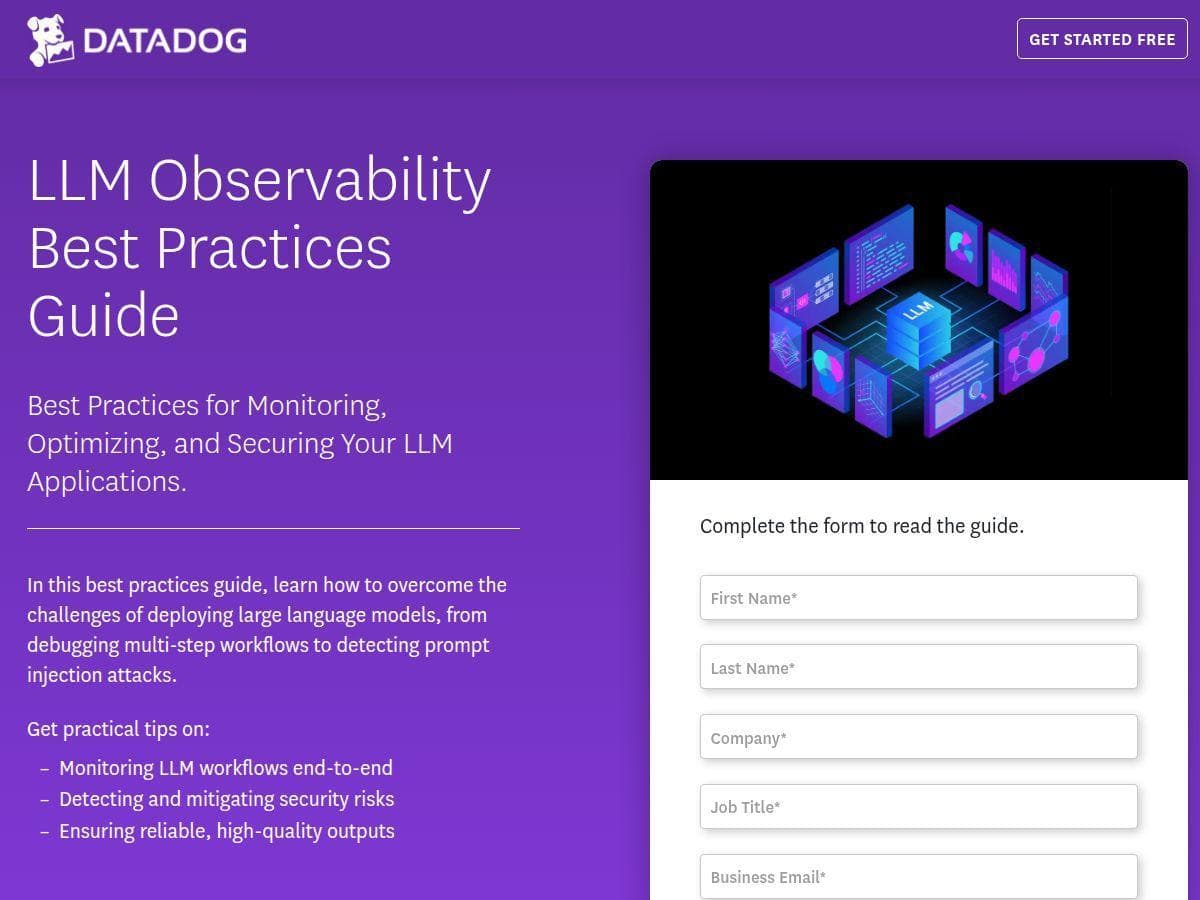
Datadog also has an LLM observability guide that’s free after you submit a form, but the platform itself is usage-based. For the latest numbers, check Datadog’s pricing page.
Here are two rough scenarios that match how teams I’ve worked with think about it:
- Small team / low traffic: You might sample traces more aggressively, avoid storing full prompt/response bodies, and keep retention shorter. In this setup, cost is usually dominated by whatever log strategy you choose.
- Production at scale: If you generate a trace per request with multiple spans (tools, retries, multi-step prompts) and you keep enough history for incident forensics, trace/log volume becomes the main cost driver. That’s also when the ROI is highest.
My advice: start with a minimal “instrumented slice” (one service + a few prompt templates), validate your dashboards/alerts, then expand. Don’t instrument everything on day one unless you’ve already modeled the ingestion impact.
Wrap up
Datadog is a strong option for LLM monitoring when you want more than basic logging. In my experience, the real payoff is the combo of tracing + actionable dashboards + security flags + evaluation. It helps you answer the questions that actually matter: Where is the slowdown coming from? Did quality drop after a change? Are we seeing injection attempts?
If you’re a small team building a simple assistant and you don’t have the engineering bandwidth for instrumentation, it might feel like a lot. But if you’re operating AI in production—especially with multiple models, tool calls, and frequent prompt iteration—Datadog is worth a serious look.