Table of Contents
If you’ve ever shipped an LLM feature and then spent the next few days asking, “Why did that answer change?” or “What actually broke in production?”—yeah, you’re not alone. Monitoring for large language models isn’t like classic web app monitoring. The failure modes are different: tool calls fail, prompts drift, latency spikes because of token load, and security issues (like prompt injection) aren’t always obvious until it’s too late.
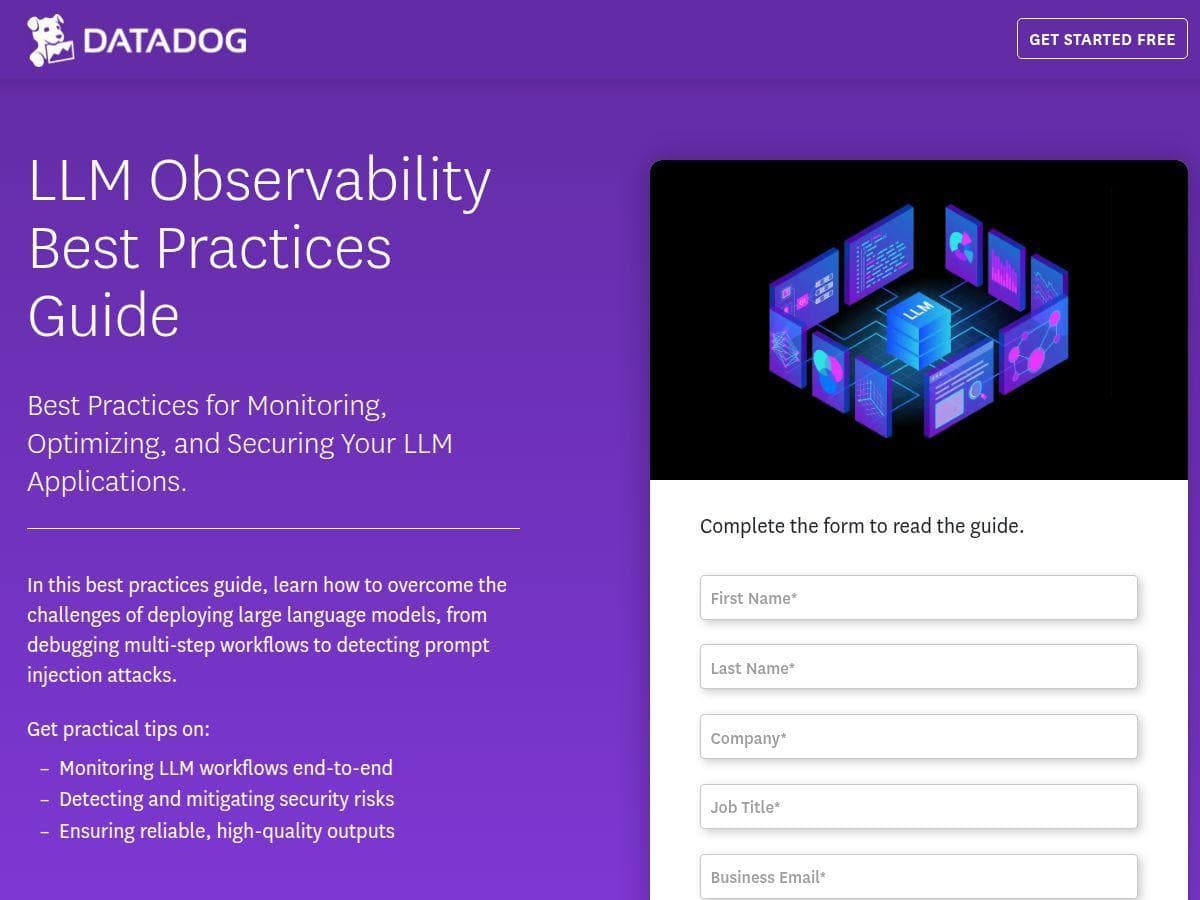
That’s where Datadog comes in. In this review, I’m going to focus specifically on Datadog’s LLM monitoring / LLM observability capabilities—what they’re good at, what’s required to get value out of them, and what I think you should watch for before you roll it out to a real team.

Datadog Review
Here’s my honest take: Datadog is one of the better “all-in” options for LLM monitoring because it doesn’t treat observability as an afterthought. It’s built around traces, logs, and metrics—then extends that mindset to LLM workflows.
What that means in practice is you can follow a single request through your system: API call → orchestration layer → model call(s) → tool/function calls → post-processing. When something goes wrong, you’re not just staring at “the model output was bad.” You can usually see where the latency came from, which step failed, and how often errors happen relative to traffic.
Security monitoring is also a big deal here. If you’re doing things like user-provided prompts, retrieval-augmented generation, or tool calling, you’re exposed to prompt injection attempts and other abuse patterns. Datadog’s approach is to help you surface suspicious behavior early enough to respond—ideally before it turns into a production incident.
One more thing: the dashboards can be genuinely useful, but only if you instrument the right signals. If you don’t capture token usage, latency breakdowns, and error categories at the right points, you’ll end up with pretty charts that don’t answer the questions your team actually asks.
Key Features
1) End-to-end workflow tracing (so you can debug like a grown-up)
Classic monitoring tells you “something failed.” LLM monitoring needs to tell you “which step failed, how long it took, and what inputs were involved.” With Datadog, the goal is to make LLM calls part of your existing tracing story.
What you typically configure
- Trace spans around your orchestration steps (prompt assembly, retrieval, model invocation, tool execution).
- Relevant attributes attached to spans (model name, request type, user/session metadata you’re allowed to store, and error codes).
- Error mapping so “tool failed” doesn’t look the same as “model returned empty output.”
What you’ll notice in dashboards
- Latency breakdown across steps (not just total end-to-end time).
- Error spikes tied to specific components (for example: tool calls failing after a dependency change).
- Correlation between token usage and latency (useful when you change prompt size or retrieval settings).
Quick setup tip: start with one “happy path” workflow and instrument only the critical spans first. If you try to trace everything on day one, you’ll spend more time wiring than learning.
2) Security monitoring (including prompt injection detection)
Prompt injection isn’t a theoretical issue anymore. If your system accepts user instructions and then blends them into a larger prompt (or passes them to tools), you need monitoring that can flag suspicious patterns.
Where this helps
- When user prompts contain instruction-like payloads aimed at overriding system behavior.
- When retrieved documents include malicious instructions (“ignore previous instructions…” style content).
- When tool calls are triggered unexpectedly (a common symptom of injection attempts).
How to make it actionable
- Don’t just alert on “detection happened.” Add context: which step flagged it (input processing vs. tool execution) and what action you took (blocked, sanitized, allowed).
- Track false positives. If your detection is too sensitive, your team will learn to ignore alerts—which defeats the whole point.
Limitation to watch: security signals are only as good as your logging and the policies you apply. If you don’t store enough safe metadata to understand why something was flagged, you’ll have alerts you can’t triage quickly.
3) Performance analytics (latency, token usage, and error rates)
This is the part most teams get value from immediately. When you’re running LLM calls at scale, latency and cost are tightly connected. Datadog’s analytics help you see both.
Signals that matter
- Latency: time spent in retrieval, model inference, and post-processing.
- Token usage: input vs output tokens (and how changes in prompt size affect both).
- Error rates: model errors, timeouts, tool/function errors, and downstream failures.
Example scenario: Suppose you update your prompt template and suddenly latency jumps 30% and costs rise. With proper instrumentation, you should be able to see whether the increase is coming from larger inputs (more tokens) or from a specific step like retrieval. That’s a huge difference from guessing.
4) Output quality and reliability (because “it ran” isn’t the same as “it worked”)
LLM reliability isn’t only about errors. Sometimes the model returns something that technically succeeded, but the output is unusable—wrong format, missing required fields, hallucinated facts, or unsafe content.
Datadog’s LLM observability is designed to support evaluation-style workflows. In my experience, the most practical approach is to define a few lightweight quality checks you can run continuously:
- Schema/format checks (e.g., JSON parses, required keys present).
- Refusal/unsafe content checks based on your policy.
- Grounding checks if you do retrieval (did citations appear? did answers reference retrieved content?).
Then you tie those outcomes back to traces. When quality drops, you want to know whether it correlates with model changes, prompt changes, retrieval changes, or tool failures. That’s where observability earns its keep.
5) Integrations and alerting (turn monitoring into responses)
Datadog’s strength is that it can plug into the monitoring stack you already have. That matters because LLM monitoring isn’t useful if alerts land in a separate silo.
What a good alert looks like
- Latency alert when model invocation spans exceed a threshold (and only for the affected workflow).
- Error budget alert when tool failures or model timeouts cross a rate (not just when a single request fails).
- Security alert when prompt injection detection triggers above a baseline for a specific route or input type.
Practical tip: start with fewer alerts and make them meaningful. If you alert on every minor anomaly, you’ll train your team to ignore everything. I’d rather have 3 high-signal alerts than 30 “meh” ones.
6) Experiment tracking and continuous evaluation (so updates don’t blindside you)
If you’re iterating on prompts, retrieval parameters, or model versions, you need a way to compare runs. Datadog supports the idea of experiment tracking and continuous evaluation, which is exactly what you want when you’re trying to answer: “Did this change improve quality without making latency worse?”
How to use this effectively
- Run controlled experiments with the same traffic pattern (or a representative test set).
- Compare not just output quality—also compare token usage and error rates.
- Keep a short history so you can roll back quickly if something regresses.
Pros and Cons
Pros
- Unified visibility: tracing + metrics + (optionally) logs makes it easier to connect “bad output” with the step that caused it.
- Actionable security signals: prompt injection detection is useful when you wire alerts to triage context (which workflow, which step, what action you took).
- Performance clarity: latency and token usage are the two biggest levers for both user experience and cost—Datadog helps you track both.
- Alerting that fits real ops: it’s not locked away in a separate tool; you can integrate with existing alert workflows.
Cons
- Setup effort can be real: you’ll get the best results only if you instrument the right spans and attach useful attributes.
- Not “set it and forget it”: quality checks and security policies need tuning over time to reduce noise.
- Cost can grow fast: depending on your ingest volume (logs/metrics/traces) and how long you retain data, LLM monitoring can become expensive if you capture too much.
Pricing Plans
Datadog’s LLM observability content and guides may be free to access, but the actual platform pricing depends on how you use Datadog—especially ingest and retention for logs, metrics, and traces.
Here are the main cost drivers I’d expect (and why they matter for LLM monitoring):
- Traces volume: if every LLM call becomes multiple spans (prompt assembly, retrieval, model call, tool calls), trace ingest can increase quickly.
- Logs volume: if you log prompts, tool inputs/outputs, or evaluation results, you can rack up ingest faster than you think. (You’ll want to be careful about sensitive data.)
- Metrics frequency: high-cardinality metrics (like per-user or per-prompt-template metrics) can get pricey.
- Retention: keeping high-detail trace/log data for long periods will raise costs.
Example scenario:
- Small team: 1–2 LLM workflows, fewer spans, short retention, and you’ll likely keep costs manageable.
- Scale-up: multiple workflows, frequent evaluations, and long retention—this is where costs can jump, especially if you store large payloads.
For exact numbers, you’ll want to check Datadog’s pricing page (the most accurate place to confirm current tiers and unit costs). If you’re evaluating, ask yourself: do you need full payload logging, or can you log references/metadata and keep payloads out of the pipeline?
Wrap up
Datadog can be a strong choice for LLM monitoring when you want real observability—not just “we saw an error.” The best results come when you instrument your LLM workflow properly (tracing spans that match your architecture), set up high-signal alerts, and tune security/evaluation checks so they’re useful instead of noisy.
If you’re running AI features at meaningful scale (or you’re in regulated territory where security and auditability matter), it’s worth a serious look. Just don’t underestimate the work required to wire the right signals—and don’t ignore cost drivers like trace/log volume and retention.