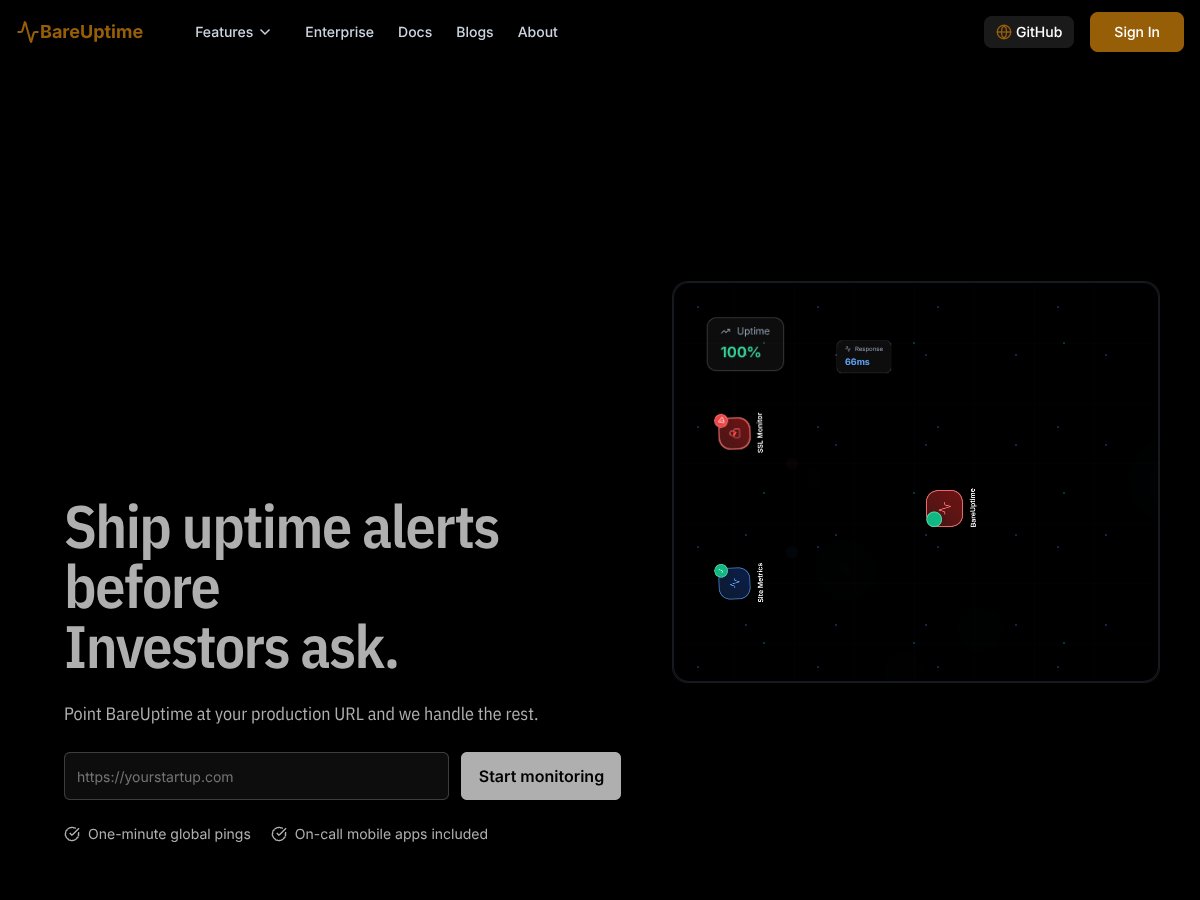
BareUptime
BareUptime offers enterprise-grade uptime monitoring for just $15/year, with high SLAs and AI monitors. Great value, but limited support on free plan.
Read review
Discover our comprehensive Livedocs review. Learn how this AI-powered data analysis tool transforms CSVs, spreadsheets, and databases into insights quickly.
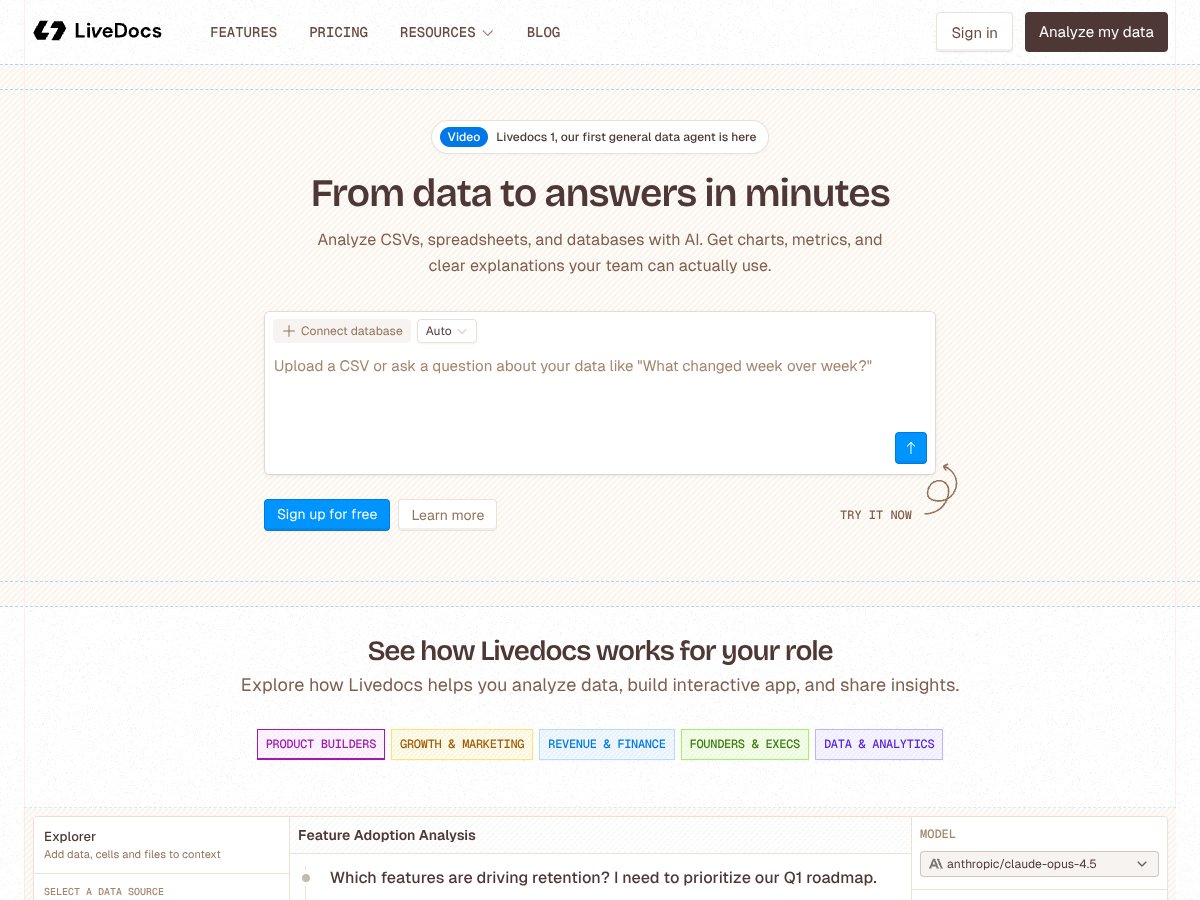
Discover our comprehensive Livedocs review. Learn how this AI-powered data analysis tool transforms CSVs, spreadsheets, and databases into insights quickly.
Continue with tools in the same category, including screenshots and published Automateed reviews.
BareUptime offers enterprise-grade uptime monitoring for just $15/year, with high SLAs and AI monitors. Great value, but limited support on free plan.
Read review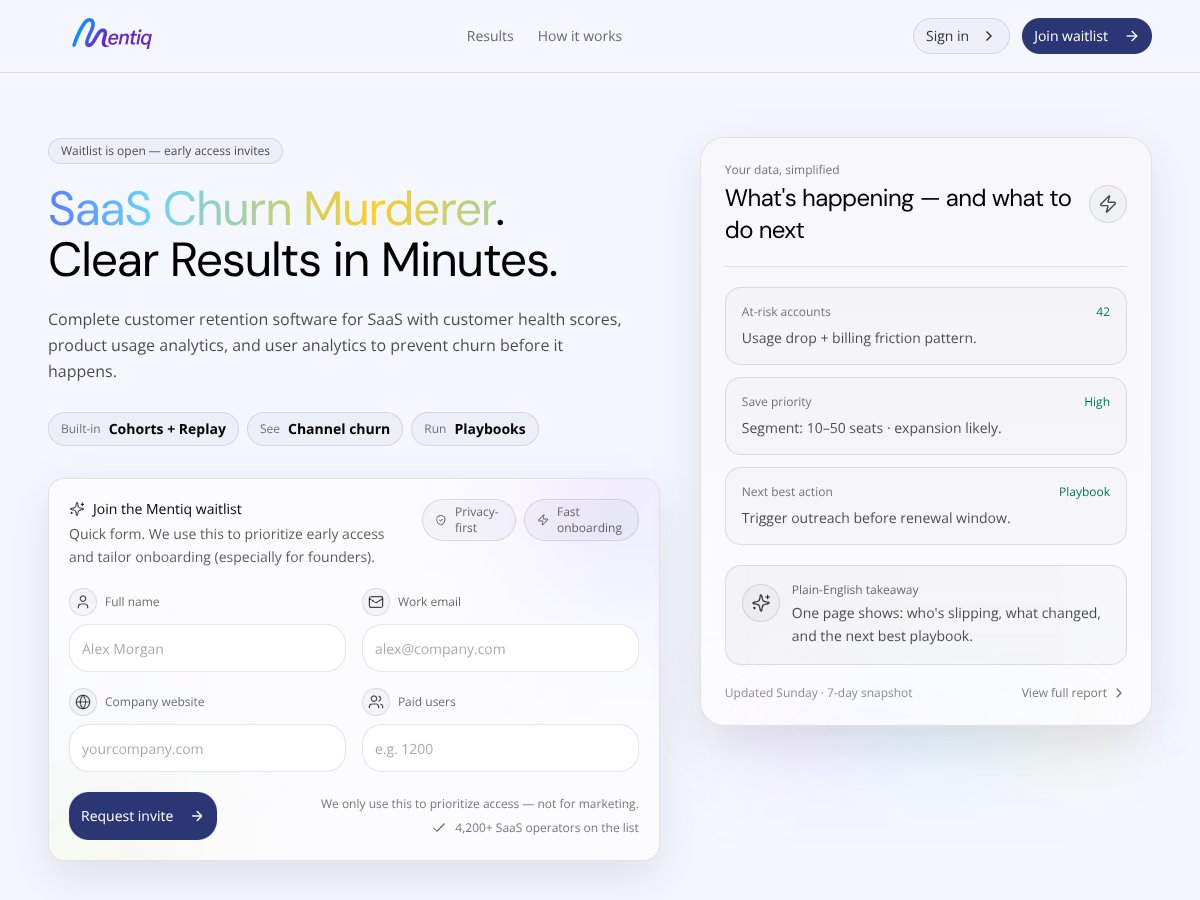
Mentiq review: Great for AI-driven retention automation but limited on pricing transparency. Here's my honest assessment after testing.
Read review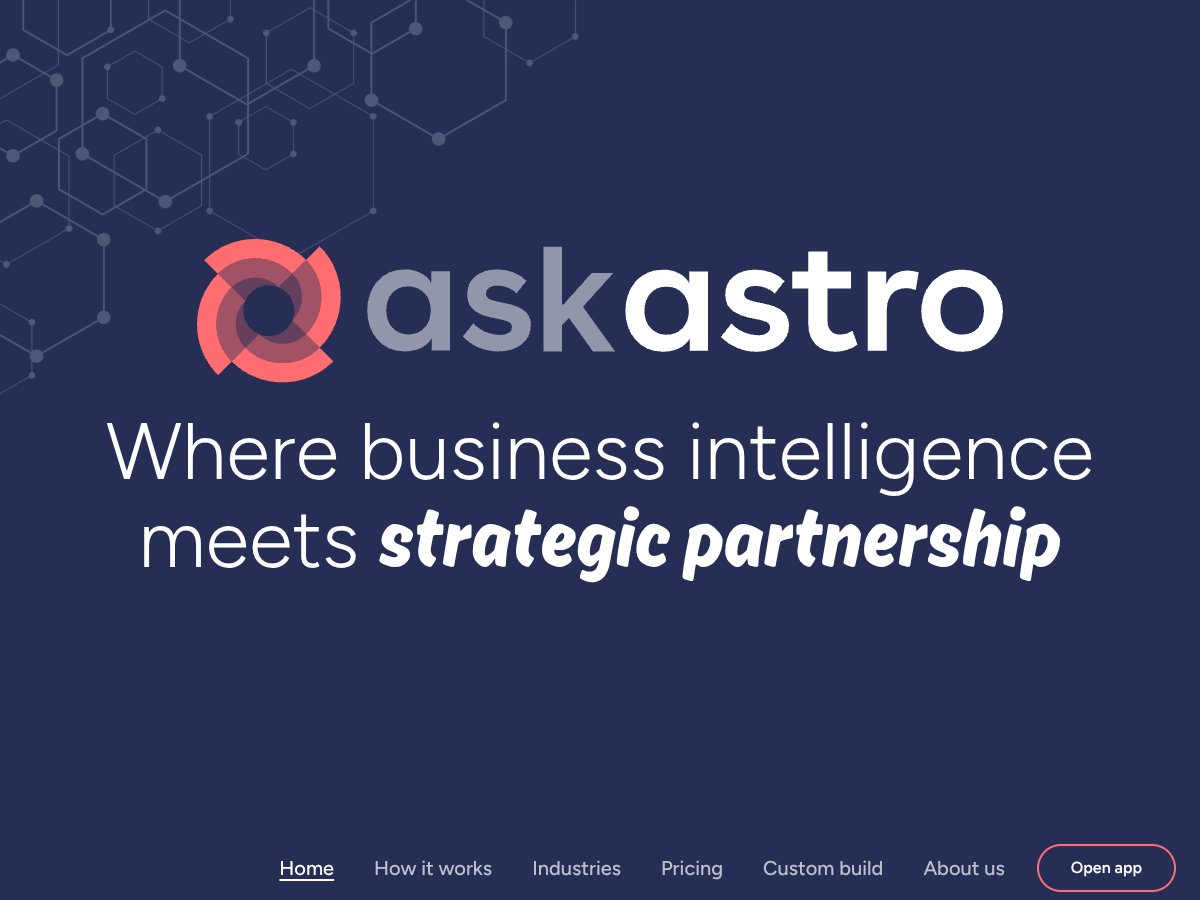
Ask Astro offers accurate Airflow answers with source links but requires self-hosting. Here's my honest review after testing this open-source tool.
Read review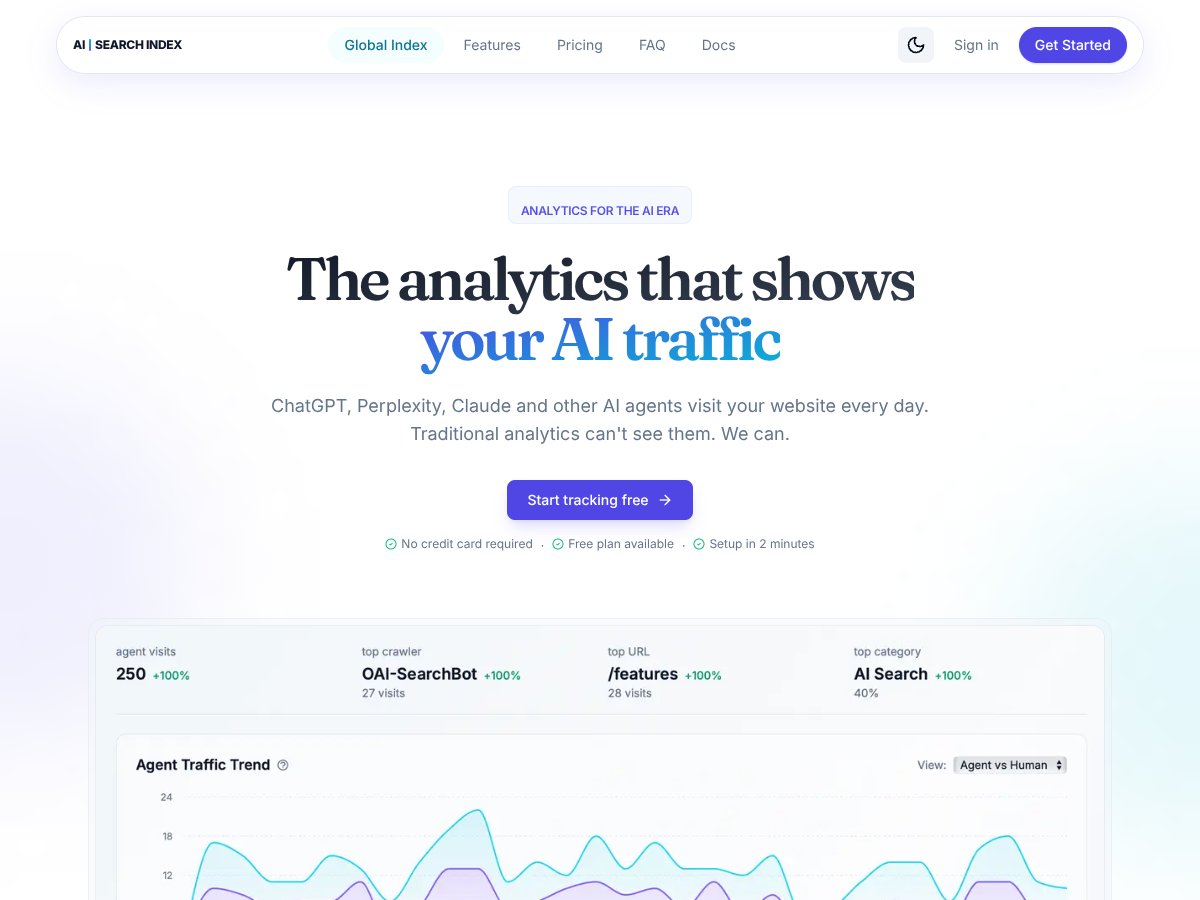
AI Search Index is great for tracking AI vs. human traffic, but limited for broader insights. Here’s my honest review after testing it out.
Read review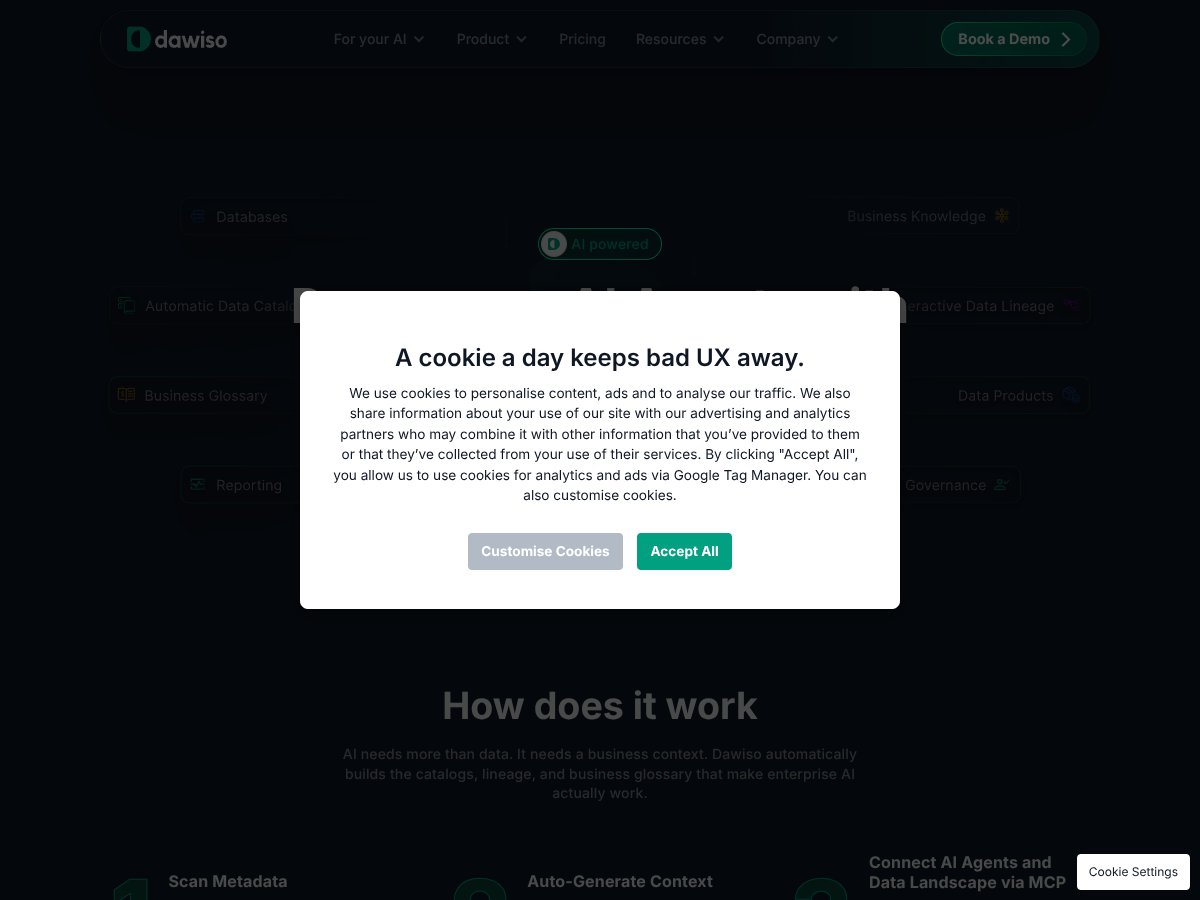
Dawiso AI Context Layer review: Great for rapid AI data context but lacks transparent pricing. Here's my honest take after testing in 2026.
Read review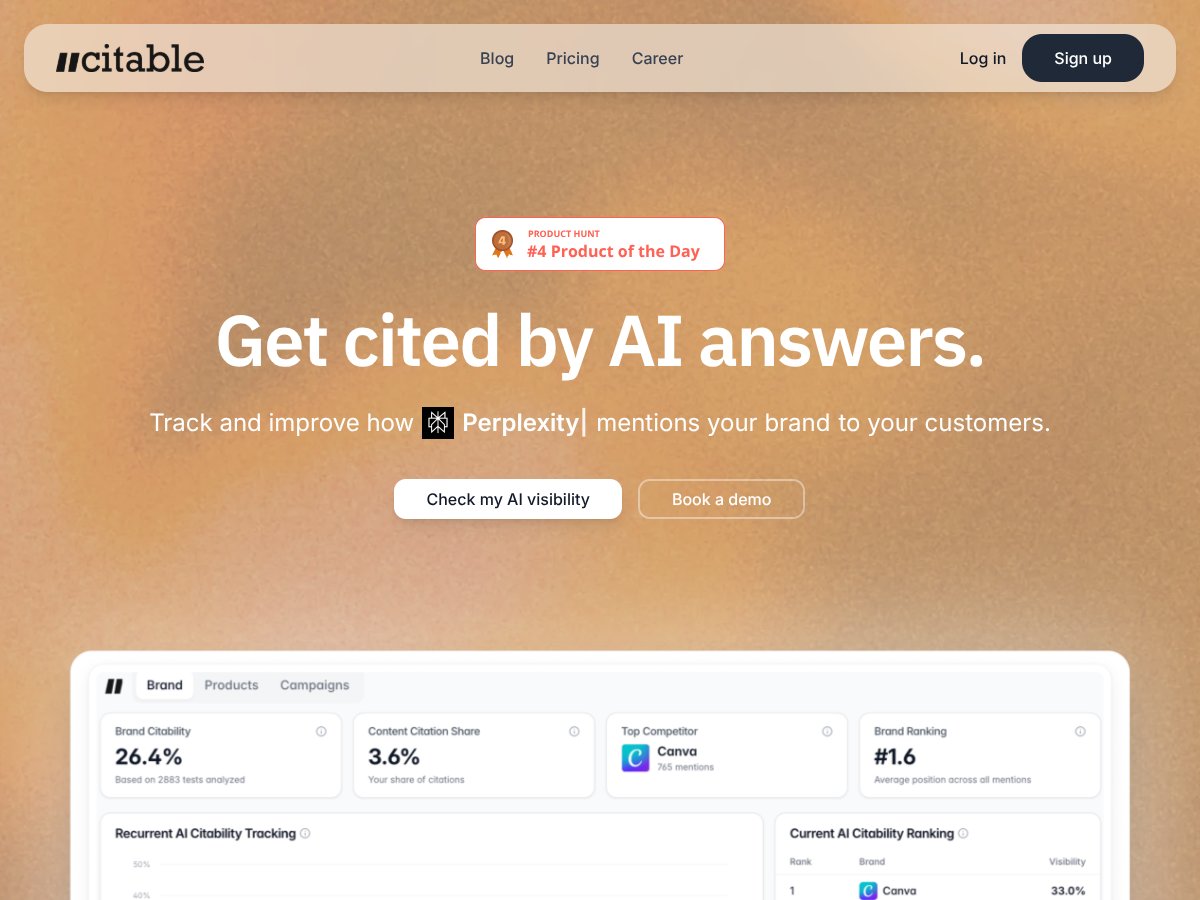
Citable review: Great for AI citation tracking but may be pricey for smaller teams. Here's my honest assessment after testing.
Read review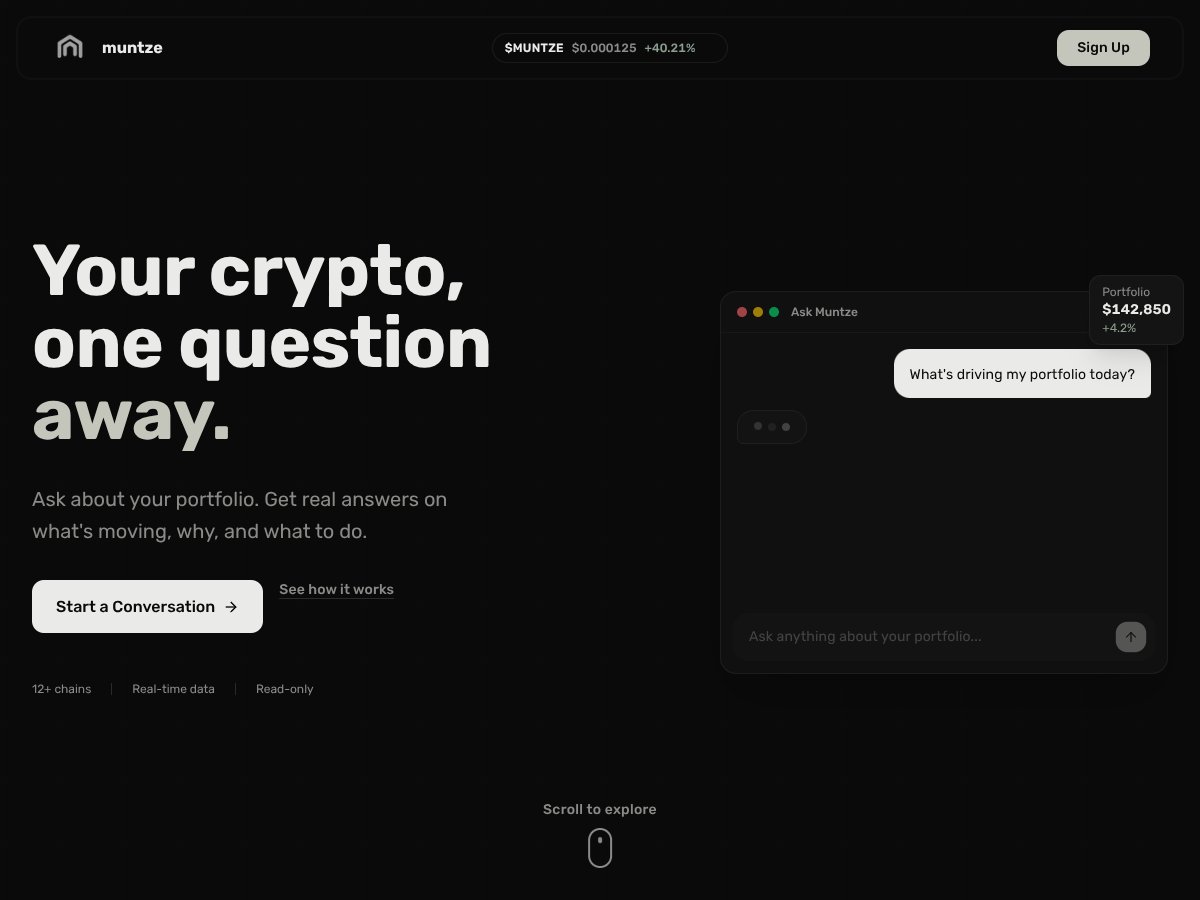
Muntze review: Great for multi-chain portfolio tracking with AI insights but lacks detailed security info. Here's my honest take after testing.
Read review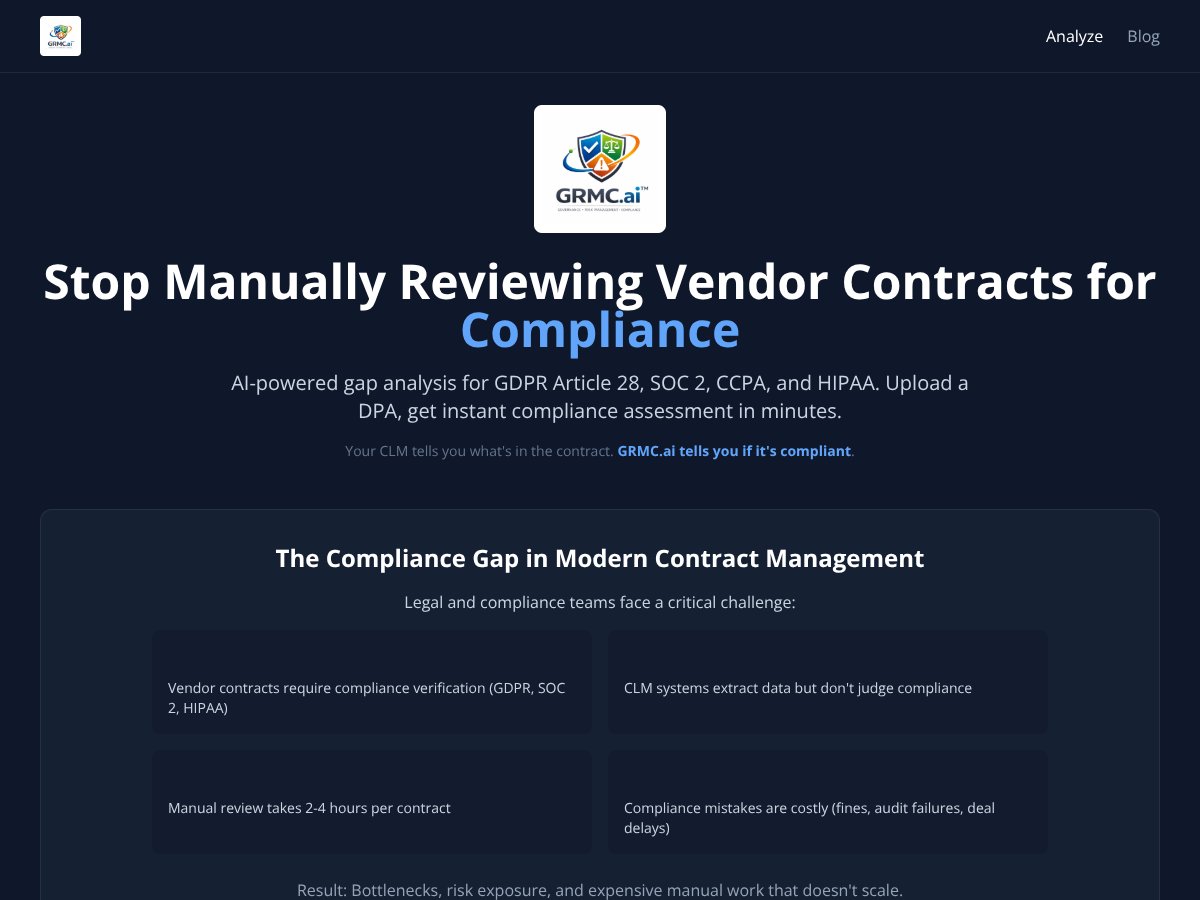
GRMC.ai review: Great for compliance automation but limited info on features. Here's my honest assessment after testing.
Read reviewAs featured on
Add this badge to your site