Table of Contents
I’ve used a few Gantt tools over the years, and most of them make you do the same boring setup: create tasks one-by-one, line up dates, then manually fix everything when priorities shift. That’s why I wanted to test Online Gantt—to see if its AI actually saves time or if it’s just marketing.
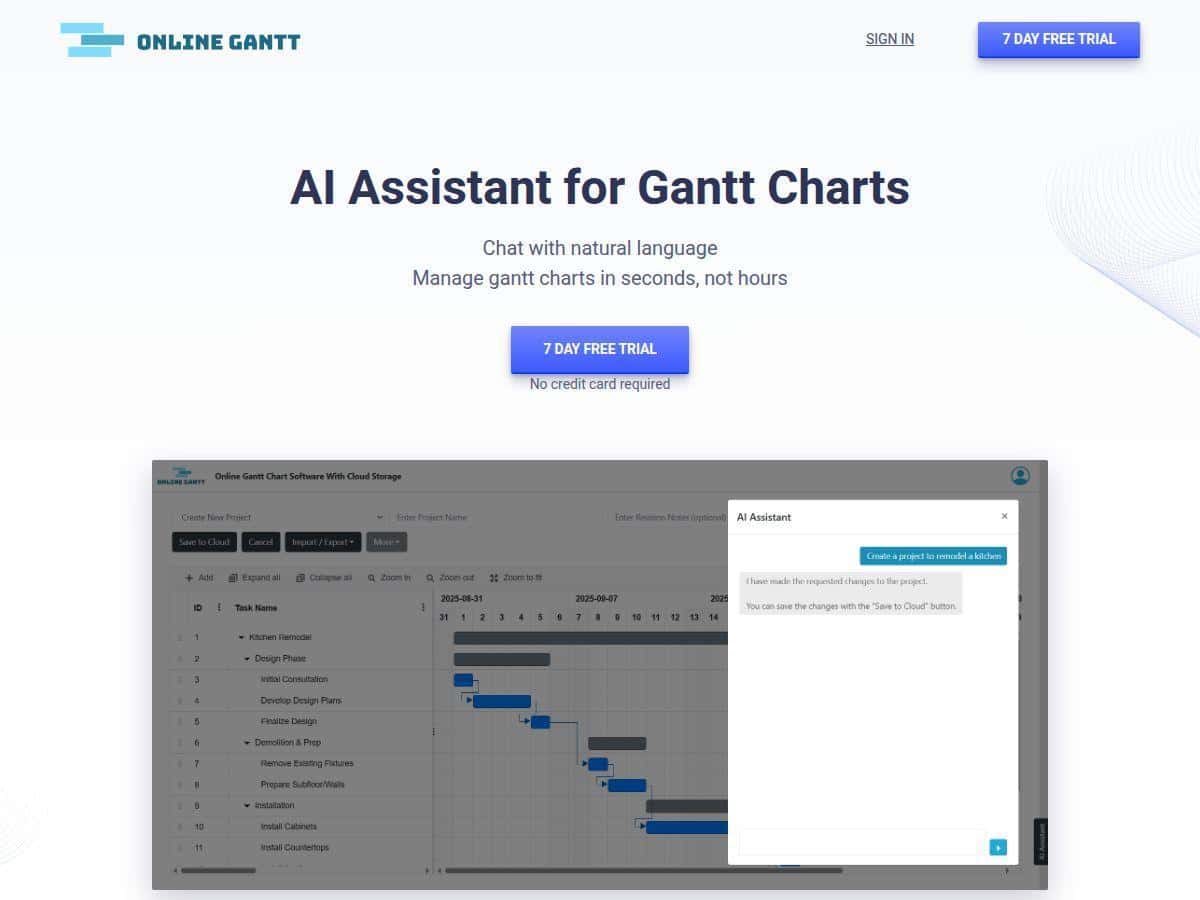
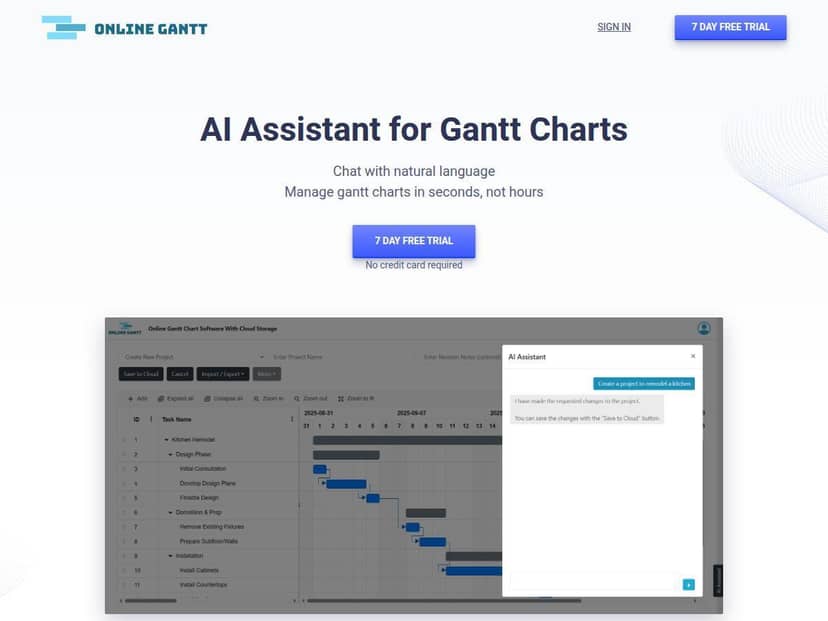
In my test, the “magic” starts right in the project creation flow. Instead of building a chart from scratch, I typed a plain-English request (basically: project goal + a rough list of tasks + time expectations). The AI generated a Gantt chart with tasks and a timeline in one shot. Then I tried the part that usually eats my time in other tools: bulk edits. I requested changes like adjusting dates and updating task statuses, and it applied them across multiple tasks without me clicking every row. That’s the real value I noticed—less fiddling.
That said, it’s not totally hands-off. If you’ve never worked with Gantt charts before, you’ll still need a little patience. Some options took me a minute to find, and the “AI edits” don’t always cover every edge case unless you’re specific with your wording. Still, for teams that want planning to feel faster, it’s a solid option.
Online Gantt Review: does the AI actually help?
I recently gave Online Gantt a spin to see how it stacks up. Setup was fast—too fast, honestly. I started by typing a natural-language request for a small project (goal + rough task list + timeline expectations). Within the chart, it created the tasks and placed them on a timeline without me manually adding every line item.
What I noticed most during testing wasn’t just the initial chart creation—it was the follow-up edits. In a typical workflow, I’d usually have to:
- find the right task rows
- update dates
- fix dependencies (or at least double-check them)
- repeat when priorities change
Online Gantt let me do similar changes by issuing commands that targeted multiple tasks at once. For example, I asked it to adjust deadlines and update task statuses in bulk, and it updated the Gantt view accordingly. The UI felt like it understood what I meant (most of the time), and that’s the part that feels genuinely useful.
Still, I ran into a couple real-world limitations:
- If your wording is vague (“move everything up”), it can be unclear which tasks you mean (especially if the chart is complex).
- If you’re new to Gantt concepts like dependencies, you’ll still need to learn what to check after AI makes changes.
So yeah—this isn’t magic, but it’s a practical assistant for project planning, especially if you’re tired of manual chart maintenance.
Key Features (and how they work in practice)
- Create Templates using natural language commands for quick project setup
- Instead of starting with a blank spreadsheet-style chart, I used plain English to describe what I needed. The AI turned that into tasks and a timeline. The “template” part matters because you can reuse a similar structure for future projects—so you’re not re-inventing the same task list every time.
- Tip I used: include a start date or time window and name the phases (e.g., “planning,” “execution,” “review”). It helps the AI generate a cleaner breakdown.
- Edit in Bulk to make fast changes across multiple tasks
- This is where I felt the biggest time savings. I didn’t want to click 30 tasks just to shift one deadline range. I gave a bulk edit instruction to move/update tasks, and it applied changes across the relevant items.
- Example from my test: when I asked for deadline adjustments and status updates across a set of tasks, the chart updated without me manually editing each bar. It’s not instant perfection, but it cut down the repetitive clicks.
- Make Revisions easily by adjusting task durations or statuses
- Revisions are usually where Gantt charts get painful. Online Gantt makes it easier to tweak durations and track changes. In my experience, the best results came when I referenced the task names clearly (rather than “the earlier task” or “the last one”).
- Edge case: if multiple tasks have similar names, you may need to clarify which one you mean.
- Instant Answers & Insights for project status, risks, and workload comparisons
- There’s an “insights” style feature where you can ask questions about the project. I used it to get a quick read on status and what might be slipping. Instead of manually scanning every bar, it helps summarize what’s going on.
- What I liked: it’s useful for quick check-ins (like “what’s at risk right now?”) when you don’t want to dig through the entire chart.
- What to watch: always sanity-check the output against your actual dependencies and dates—AI summaries are only as good as the data in the chart.
- Auto-Scheduling that plans timelines based on dependencies
- Auto-scheduling is the feature I typically rely on when dependencies exist. In the UI, it’s essentially the “let the chart adjust itself” option. When dependencies are defined, it recalculates the timeline so you don’t break the plan every time you change one task.
- Mini walkthrough: define/confirm task dependencies → run auto-scheduling → review updated start/end dates → adjust anything that doesn’t match your real constraints.
- Predictive Analytics to identify potential delays and bottlenecks
- I tested the “predictive” angle by asking for risk/delay insights. What it produced was a quick identification of where delays could show up—basically the tasks that look most likely to affect the overall timeline.
- Reality check: predictive analytics can’t know your team’s real availability like a human planner can. It’s best used as a “here’s what to look at” signal, not a guaranteed forecast.
- Resource Optimization for better team workload management
- This is aimed at balancing workload. In practice, it’s most helpful when you’ve assigned resources to tasks (or at least have a way to represent who’s doing what).
- My take: if your project data is messy or resources aren’t mapped clearly, optimization won’t magically fix that. Garbage in, garbage out applies here too.
- Scenario Planning to test different project outcomes
- Scenario planning lets you explore “what if” changes. I used it as a way to sanity-check alternate timelines—like shifting a phase earlier/later and seeing how the rest of the chart responds.
- Tip: label your scenarios clearly (even if it’s just in notes). Otherwise, it’s easy to lose track of which version you’re looking at.
- Export & Integration options with platforms like Google Sheets and Jira
- If you collaborate with tools outside the Gantt app, exports matter. Online Gantt supports export and integrations (including Google Sheets and Jira, based on what’s listed in the product).
- What I’d recommend: before migrating a real project, export a small test chart first and check that task names, dates, and dependencies come through the way you expect.
Pros and Cons from my testing
Pros
- Bulk edits feel genuinely faster compared to manual clicking. In my workflow, that’s the difference between “updating the chart” and “actually planning.”
- Natural language is practical—it’s not just a gimmick. When I named tasks clearly, the AI edits landed much more cleanly.
- Insights help you scan the project without staring at every timeline bar. It’s great for quick status checks.
- Export/integration support makes it easier to keep Gantt as the planning layer while still working in tools your team already uses.
Cons
- Newcomers may need a learning curve—Gantt concepts like dependencies and duration logic aren’t automatically intuitive just because the AI exists.
- Advanced customization can get overwhelming if you try to configure everything at once. I found myself going back to basics and simplifying before going deeper.
- AI results depend on how specific you are. Vague requests can lead to edits you didn’t intend (especially when task names overlap).
- Pricing details can be confusing if you don’t compare plan limits. Some functionality may be capped or locked—so it’s worth checking what’s included in your tier before you commit.
Pricing Plans (what I found)
Online Gantt’s pricing starts at $10 per user per month with an annual plan at $8 per month. They also offer a 7-day free trial and, based on the info available, you don’t need a credit card to start.
If you’re evaluating it for AI-heavy planning, I’d use the trial to test the exact workflows you care about—bulk edits, exports, and whatever “insights” features you plan to rely on. Don’t just create one chart and call it a day.
Wrap up
After using Online Gantt, my honest take is this: it’s best when you want speed and you’re okay guiding the AI with clear instructions. The natural-language setup and bulk editing are the standout parts, and the insights/prediction features are handy for quick project awareness—just don’t treat them as a replacement for checking dependencies and dates.
If you’re migrating from something like Excel or a traditional Gantt workflow, start with a small pilot project, export once to verify formatting, and then decide if the AI-driven editing is worth the subscription for your team. The free trial is there for a reason—use it to stress-test your real planning routine.