Table of Contents
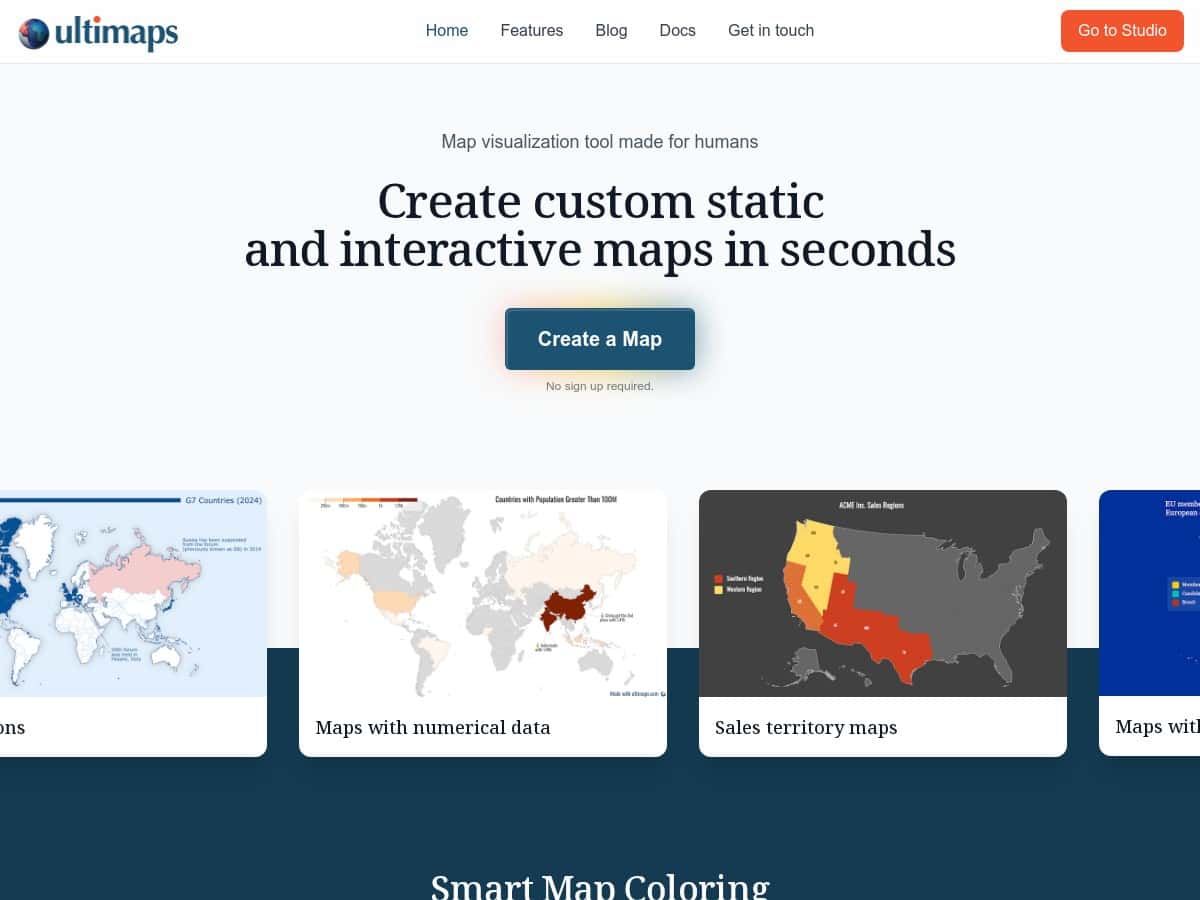
If you’ve ever stared at a spreadsheet and thought, “I really need a map for this… but I don’t want to learn design or GIS,” I get it. That’s basically what I was hoping Ultimaps would solve. I tested Ultimaps to see how fast it could turn messy data into something presentation-ready, and honestly? It’s one of the smoother “no-code” mapping tools I’ve used.
In my case, I didn’t start with some perfect dataset. I used a CSV export from a real workflow (columns for a location field and a numeric value). Ultimaps let me import quickly, pick a map style, and generate a choropleth-style visualization without me doing anything complicated. The part that surprised me most was the amount of polish you get early—legend, color scale, and tooltips were already in place instead of feeling like a half-finished template.

Ultimaps Review (2026): Simple Custom Maps in Minutes
Here’s the honest version: Ultimaps feels built for people who want results fast. I didn’t spend hours tweaking layers. I imported my data, chose a map type, and then adjusted styling until it looked right for my audience.
What I did in my test
- Imported data: I started with a CSV (location + numeric value). Import was quick—just a few clicks—and I didn’t run into any “why is it not mapping?” drama right away.
- Generated the first draft: Instead of manually building everything, I used the AI prompt feature to describe what I wanted (title/format, and a clean color scheme). The first map came out usable immediately.
- Checked the interactive bits: I clicked around to test tooltips. They weren’t just placeholders—values showed up the way you’d expect, and it made the map feel less like a static image.
- Exported it: I tried exporting to common formats (PNG/SVG/PDF are mentioned in the product flow, and those are the formats you’ll care about if you’re using maps in slides or reports).
Time-to-first-map (my experience)
From import to a map I was comfortable sharing took me minutes, not hours. The styling and legend setup felt “pre-thought-out,” which is exactly what I wanted. If you’re the kind of person who just needs a good-looking map for a meeting tomorrow, this matters.
One thing to watch
“Maps rendered locally for better privacy” is great, but don’t just assume it means “totally offline forever.” In practice, you still need the app/browser flow to process your data and generate the output. If you’re handling sensitive datasets, you’ll want to review Ultimaps’ privacy notes and any documentation on how data is processed during the mapping steps.
Key Features That Actually Matter
Feature lists are easy. So I focused on what those features look like when you’re building a map.
- Smart Map Coloring
In my test, the “smart” part showed up in the color scale, legend, and how the map bins were chosen. I didn’t have to hunt for the right palette or manually adjust the legend just to make it readable. When I changed the style, the legend updated and the scale stayed consistent. - Import from Excel, CSV, Google Drive, and Notion
I used CSV, but the workflow felt similar for other sources: bring in the data, map the fields, and generate. If your dataset is already in a spreadsheet, you won’t feel like you’re starting from scratch. - AI prompts for map creation
I tried describing the map like a human would: what the data represents and what I wanted the output to look like. It helped me get to a first draft without fiddling with every setting. That’s the real value—speed. - Custom map styling (and added elements)
You can customize styles and add things like pins, drawings, and annotations. In my opinion, this is where Ultimaps starts to feel “presentation-ready,” because you can guide attention instead of leaving everything as-is. - Interactive tooltips and popups
This is one of the best parts. I clicked through the map and checked that hover/click states weren’t laggy and that the tooltip content matched the underlying data fields I imported. - Embed on websites or share via links
Sharing is straightforward. For public-facing pages, embedding is convenient. For internal teams, link sharing is usually enough. - Auto-saving and responsive layouts
I tested the map view on different screen sizes. The layout stayed usable instead of breaking into awkward zoom levels. - “Rendered locally” for privacy
This is a meaningful claim, especially if you’re cautious about where data goes. Still, I recommend double-checking Ultimaps’ privacy documentation for what “local rendering” covers during import, processing, and export.
Pros and Cons (Based on What I Ran Into)
Pros
- Beginner-friendly: I didn’t need design skills to get a clean result. The interface is straightforward, and the default outputs are already decent.
- Fast to first result: Import → first map → tweaks was quick in my test.
- Free tier is usable: The free plan is great if you just want to experiment and share.
- Good interactivity: Tooltips and popups made the map feel alive, not static.
- Styling + annotations: You can make the map match your story, not just your data.
- Responsive: It works across devices without looking like it was built for one screen size only.
Cons
- Advanced export/features can be Pro: If you need the best export options, you’ll likely hit limits on the free plan and need the paid tier.
- Some sharing/embedding customization may require a subscription: In other words, you can share, but the “make it perfect” version can cost extra.
- More complex setups need support: If you’re looking for enterprise features, custom themes/workspaces, or special requirements, you’ll probably need to talk to the team.
- Price may not fit casual users: The Pro plan is fine if you’ll use it regularly, but if you’re only making a couple maps a year, it could feel steep.
Pricing Plans (What You Get for Free vs Pro)
Ultimaps has a free Basic plan. In my experience, it’s enough to start creating maps and sharing them, and it’s a good way to figure out whether the workflow clicks for you.
For more advanced outputs—like higher-end export options (including SVG/PDF) and templates—there’s a Pro plan listed at €49 per month (about €199 annually). If you need cleaner deliverables for reports or slide decks, that’s where the paid tier usually becomes worth it.
They also offer a Custom plan for business needs, including private sharing, multi-user workspaces, and custom themes. If you’re in that category, you’ll want to contact the Ultimaps team and ask what “custom” includes for your exact use case.
Who Ultimaps is best for (and who should skip it)
Ultimaps is a great fit if: you need maps quickly for business updates, education projects, internal reporting, or client presentations—and you don’t want to spend your night learning map styling tools.
I’d be a little cautious if: you’re building highly technical GIS workflows, need extremely fine-grained control over projections and layers, or you’re only making maps occasionally and don’t want to deal with paid-tier limitations for exports.
Wrap up
After using it, my takeaway is simple: Ultimaps makes map creation feel closer to “visualizing your data” than “building a map from scratch.” If you want something you can get working fast, look good on screen, and share without a ton of effort, it’s worth trying. Just make sure you check the privacy/process details for your situation and confirm which export options you’ll need before you commit to Pro.