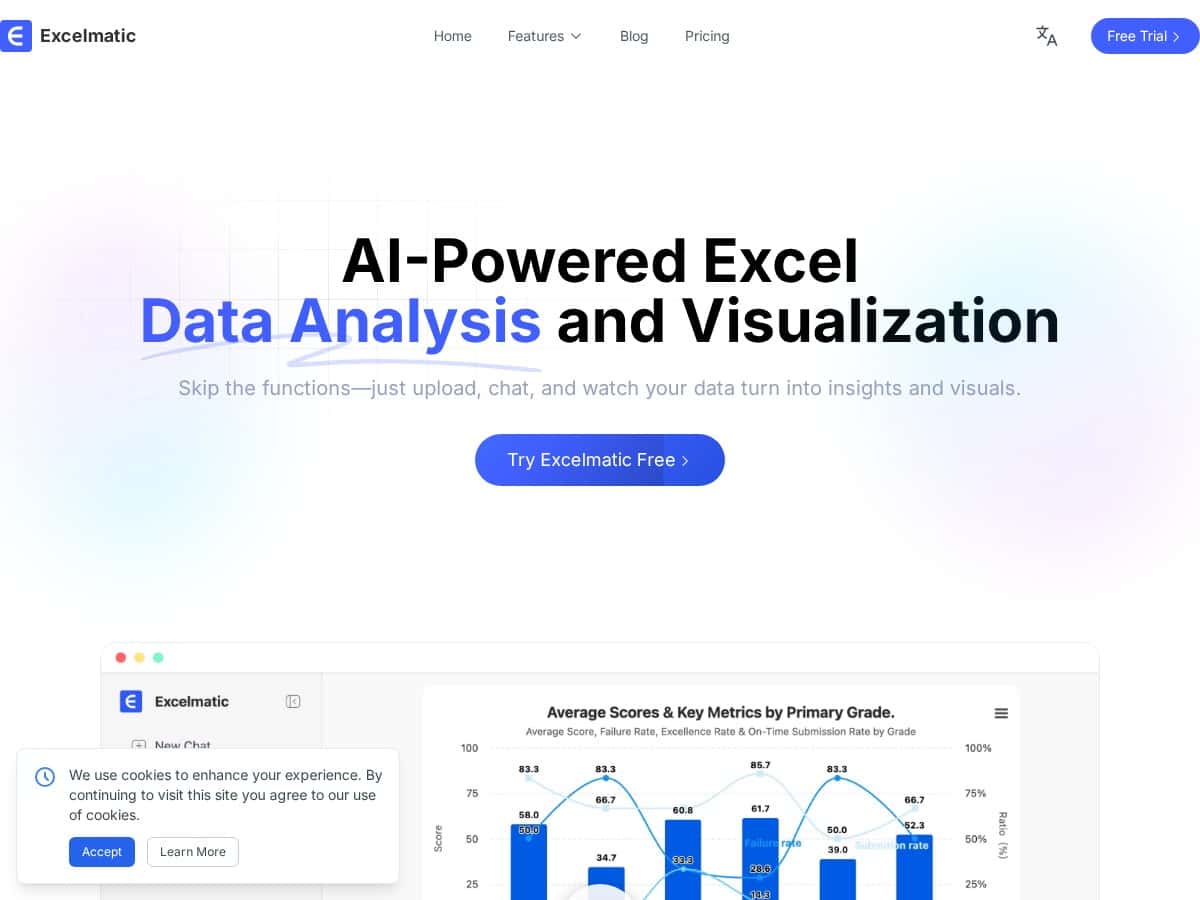
LIFETIME DEAL — LIMITED TIME
Get Lifetime AccessLimited-time — price increases soon ⏳
AI Tools

Excelmatic Review – Simplify Your Data Work with AI

Updated: April 20, 2026
8 min read
#Ai tool#Data Analysis

Table of Contents

I’ve used Excel for years, but I’m definitely not the person who loves wrestling with formulas all day. My usual workflow is messy: I download a CSV, clean it up, deduplicate rows, standardize dates, then I try to build a pivot-style summary (and half the time I’m copy/pasting formulas until they behave). That’s why I tested Excelmatic—to see if AI could actually reduce the boring parts without turning everything into a black box.

After a few weeks, here’s what stood out: Excelmatic is easiest when you already know what you want (clean this column, create a chart, summarize sales by month). Where it gets less impressive is when your spreadsheet logic is truly complex or when you hit usage limits on the free tier. Still, for everyday data prep and reporting, it can save real time.

Excelmatic

Excelmatic Review: what I actually used it for

I tested Excelmatic on a pretty typical “real life” dataset: a sales export in CSV form (about 2,000 rows) with messy dates, a few blank cells in key columns, and some duplicate customer/order rows. I also tried a smaller table (around 200 rows) just to see how quickly it responded when I was iterating.

The first thing I noticed is that the interface is straightforward. Instead of hunting through menus, you basically type what you want. And when it works, it feels like you’re skipping the part where you’d normally pause and ask, “Wait… how do I write that exact formula again?”

1) Data cleaning: duplicates + dates (where it saved me time)

One of my end-to-end tests was cleaning a “Orders” sheet where the Date column had mixed formats (some entries were real dates, others were text). I prompted:

Prompt I used: “Clean the Date column so every row becomes a real date. Remove rows where both Customer and Order ID are blank. Deduplicate by Customer + Order ID.”

What I saw: Excelmatic produced a set of cleaning steps I could review. The key win here was that it didn’t just spit out one magic formula—it suggested a workflow (clean, filter blanks, then dedupe). In my case, that reduced what would’ve been 20–30 minutes of manual filtering and formula tweaking down to closer to 8–12 minutes.

Small caveat: if your column headers are inconsistent (like “order id” vs “OrderID”), you’ll need to point it to the right columns or it may apply the rule to the wrong range. I had one hiccup like that, and once I clarified the column name, it corrected the mapping.

2) Formula help: getting the output I expected (and catching mistakes)

Next I tried a more “formula-y” task: calculating monthly totals and then creating a quick variance vs the previous month. I used this prompt:

Prompt I used: “Create a new column called Month (YYYY-MM) from Date. Then calculate Total Sales per Month. Add a column for MoM change using the previous month total.”

Result: it generated the Month grouping in a way that matched my expectation, and the MoM change logic was close enough that I only had minor adjustments. The part I liked most was that it didn’t feel like I was guessing. I could trace what it was doing and sanity-check it.

To be fair, it’s not perfect. When I later changed the sales column name from “Sales” to “Revenue” mid-test, it initially referenced the old header. That’s on me for moving columns, but it’s also a reminder: if your sheet layout changes, re-run the prompt with the updated column names.

3) Chart creation: quick visuals, not always “publication perfect”

For visuals, I asked it to generate a chart based on the same monthly totals. I prompted:

Prompt I used: “Create a line chart showing Total Sales by Month. Use Month on the x-axis and Total Sales on the y-axis. Title it ‘Monthly Sales Trend’.”

What I noticed: the chart came together fast and looked correct immediately. I did end up adjusting formatting (font size and label density) the way I normally would, but I didn’t have to rebuild the chart from scratch. So yes—time saved, especially if you’re doing the same report layout repeatedly.

4) Image to Excel: when it’s useful (and when it’s not)

I also tested the AI Image to Excel angle by converting a screenshot of a small table into an editable sheet. This is the feature I’d recommend most to people who work from PDFs, scanned reports, or exported screenshots.

In my test, it converted the table structure fairly well, but I still had to check a couple cells for number formatting (some values came in as text). If your image is blurry or the table gridlines are faint, expect extra cleanup—just like you would with any OCR workflow.

Overall, Excelmatic is strongest for: cleaning, summarizing, and charting from an existing dataset. It’s weaker when you need deeply custom spreadsheet logic (the kind with lots of branching, edge-case rules, and complex data models).

Key Features (what they mean in practice)

  1. AI Spreadsheet Assistant for smart Excel operations using natural language (you describe the outcome; it builds steps/formulas).
  2. AI Data Analysis for statistical insights (useful for quick summaries, not a replacement for a full analytics workflow).
  3. AI Data Visualization for instant chart creation (fast drafts; you may still tweak formatting).
  4. AI Business Intelligence for actionable insights (best when your data is already structured and labeled).
  5. AI Image to Excel for converting photos of tables into editable spreadsheets (handy for reports, but still needs cleanup sometimes).
  6. Automated data cleaning with customizable rules (dedupe, filter blanks, standardize formats).
  7. Formula error detection and suggestions (helpful when you’re stuck, but verify the references).
  8. Support for batch processing and dynamic updates (nice when you’re iterating on the same template/report).

Pros and Cons (based on my tests)

Pros

  • Easy to use: I could get meaningful output without being an Excel power user. My cleaning prompt worked after I clarified the column names.
  • Time savings on repetitive tasks: deduping + date standardization went from ~20–30 minutes to ~8–12 minutes on my 2,000-row dataset.
  • Charts are quick to generate: I got a correct line chart immediately, then only adjusted formatting (instead of rebuilding from zero).
  • Good for report-style workflows: monthly summaries and “pivot-like” outputs were the sweet spot.
  • It feels interactive: when I changed prompts, it updated the logic rather than making me start over every time.

Cons

  • Free version has real limits: you can burn through your monthly chat messages faster than you’d expect if you’re testing multiple prompts and revisions. I hit the point where I had to slow down and prioritize.
  • Advanced tasks push you toward paid plans: deeper analysis and more flexible workflows weren’t consistently available under the free tier.
  • Internet connection may be required for some actions: on a flaky connection, a couple requests took longer than normal.
  • Not ideal for very complex models: if your spreadsheet has lots of interdependent logic, you’ll still need to think like an Excel developer. AI won’t magically make a complicated model “simple.”

Pricing Plans (and what the limits mean)

Excelmatic has three plans: Free, Essential, and Professional.

On the free plan, you get 10 chat messages monthly plus limited image conversions and basic features. In practice, that means you can try one full workflow (like cleaning + one chart) or do a couple small formula questions—but if you’re the type who iterates a lot (“try again, different chart, different filter…”), you’ll run out quickly.

The Essential plan is $9.90/month. It unlocks more messages/images and basic analysis tools. For me, this would be the “I do this weekly” tier—enough to get through a small reporting cycle without constantly worrying about the cap.

The Professional plan is $29.90/month. It’s aimed at full access, including advanced analytics, full customization, and priority support. If you’re producing recurring dashboards or you regularly convert images/tables into spreadsheets, this is the tier that makes the most sense.

One straight answer: if you’re only doing occasional cleanup once in a while, free might be enough. If you’re doing monthly reporting and you want to iterate prompts without stopping, you’ll probably want a paid plan.

Wrap up: should you use Excelmatic?

Excelmatic is worth checking out if your Excel work is mostly about cleaning messy data, generating summaries, and making charts for reports. In my experience, it’s especially helpful when you’re not trying to reinvent a complex model—you just need the spreadsheet to behave and look good.

If you’re dealing with highly complex formulas, deeply nested logic, or custom business models, don’t expect AI to replace your spreadsheet expertise. You’ll still need to review outputs and understand what’s happening under the hood.

For me, the deciding factor was simple: it cut down the boring parts (dedupe, standardize dates, draft charts) without making me start from scratch. That’s a win—especially when you’re short on time and you just need the data to be usable.

Stefan

Stefan

Stefan is the founder of Automateed. A content creator at heart, swimming through SAAS waters, and trying to make new AI apps available to fellow entrepreneurs.

Related Posts

Figure 1

Strategic PPC Management in the Age of Automation: Integrating AI-Driven Optimisation with Human Expertise to Maximise Return on Ad Spend

Title: Human Intelligence and AI Working in Tandem for Smarter PPCDescription: A digital illustration of a human head in side profile,

Stefan

ACX is killing the old royalty math—plan now

Audible’s ACX is moving from a legacy royalty model to a pooling, consumption-based approach. Indie audiobook earnings may swing with listener behavior.

Jordan Reese
AWS adds OpenAI agents—indies should care now

AWS adds OpenAI agents—indies should care now

AWS is rolling out OpenAI model and agent services on AWS. Indie authors using AI workflows for writing, marketing, and production need to reassess tooling.

Jordan Reese

Create Your AI Book in 10 Minutes