60-second summary
Quick answer
Open Publisher Sites → Analytics and compare Last 7 days, Last 30 days, Subscribers, Sales, Revenue and Royalties. Visits measure site activity; sales and royalties measure monetization.
Before you start
What you need
- Have a live Publisher Site connected to the signed-in author account.
- Have recorded visits, subscribers or completed orders before expecting non-zero analytics.
Procedure
Complete the task step by step
- 01
Open Publisher Sites
Choose the live site and open its analytics view.
Current app screenOpen full size: Automateed Publisher Site analytics cards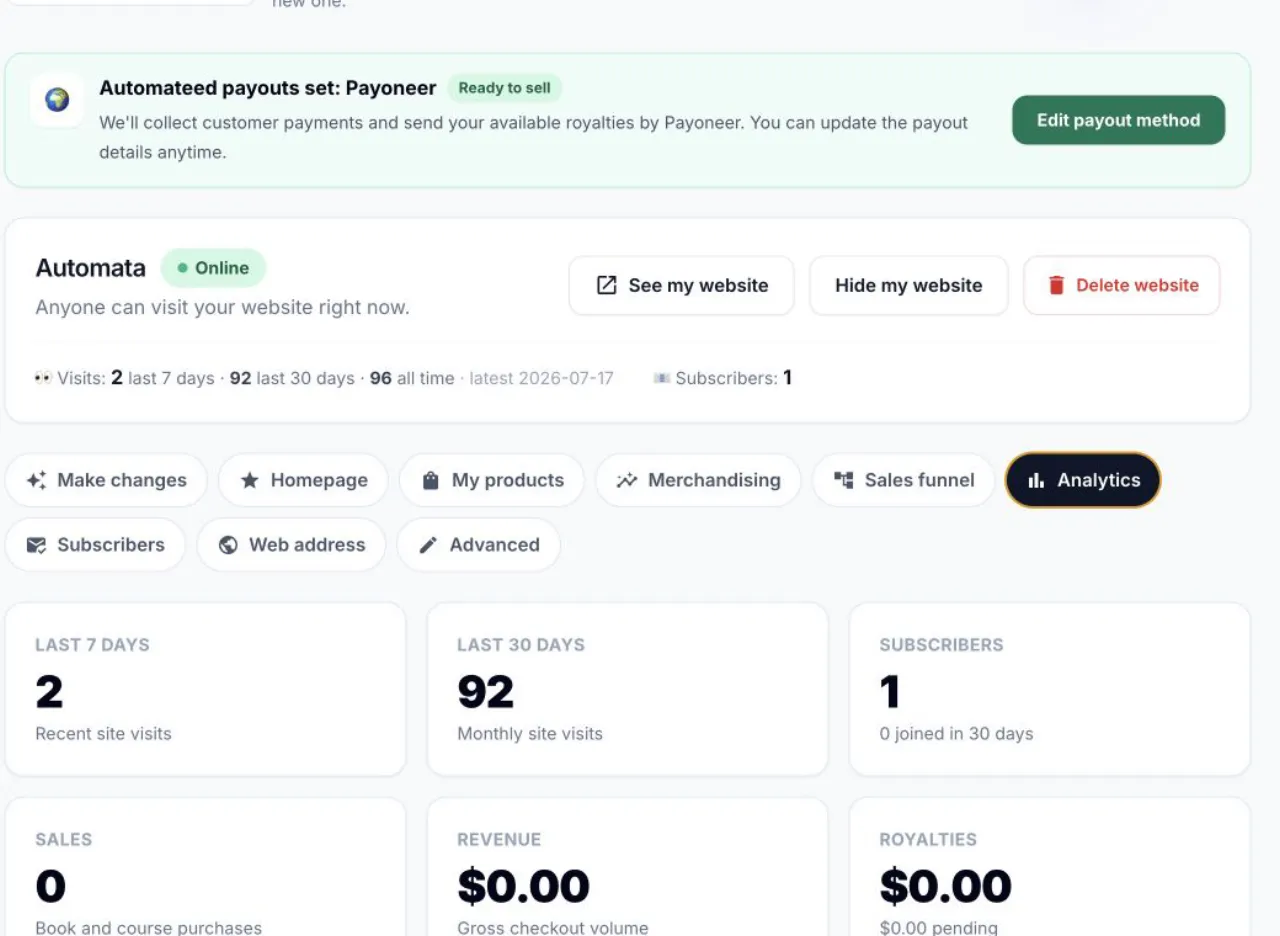
The site-level Analytics tab includes visits, subscribers, sales, revenue, royalties, top pages and recent sales. - 02
Use the available periods
Review the fixed 7-day and 30-day summary cards, plus the 30-day chart. There is no arbitrary date picker in this view.
- 03
Separate visits from sales
Traffic indicates interest; completed paid orders are the revenue event.
- 04
Review product attribution
Check which books or courses generated orders through the site.
Success check
Confirm that it worked
- You can separate Last 7 days and Last 30 days visits from Subscribers, Sales, Revenue and Royalties.
- You have reviewed Views over the last 30 days, Top pages and Recent sales, including the displayed product type and product ID.
Important notes
- The current Publisher Site analytics screen does not provide an arbitrary date-range picker.
- Page visits are attention signals and must not be interpreted as completed product sales.
Troubleshooting
If it still does not work
Recent sales is empty after visitors opened a product page
Confirm that a completed purchase was connected to the author website; a page view alone does not create a sale or royalty entry.
A recent sale is difficult to identify
Use the displayed product type and product ID, buyer or Guest label, amount and royalty because this list does not guarantee a recognizable product title.