
Table of Contents
US self-publishing produced 3,529,980 ISBN-bearing titles in 2025, an increase of 38.7% from 2024. That was a calculated 84.6% of the 4,172,222 titles in the combined self-published and traditional output table. The figures show how much was published, rather than how many copies sold or how many individual authors were involved. publishersweekly.com
What did authors earn? In Written Word Media's 2025 survey, 44% reported monthly book income of $100 or less. ALLi's separate 2025 report found $13,500 in median annual gross income among its qualified respondents. Below, we'll look at both groups, then explore catalog size, formats and sales channels so you can see which comparisons are useful for your own plans. writtenwordmedia.com
Self-publishing statistics at a glance
| Measure | Reported value | Year and scope |
|---|---|---|
| US self-published title output | 3,529,980 | 2025; Bowker’s ISBN-based count |
| US traditional-publisher output | 642,242 | 2025; same reported dataset |
| Self-published output growth | 38.7% | 2024–2025; change in titles, not purchases |
| Monthly book income of $100 or less | 44% | Written Word Media’s 2025 respondents |
| Amazon named largest revenue source | 83% | Written Word Media’s 2025 respondents |
| Median annual gross income | US$13,500 | ALLi’s 2025 report; 1,520 qualified responses |
The output figures come from Bowker’s table published by Publishers Weekly; the income and channel figures come from the named surveys. Their different units should remain attached whenever these statistics are quoted. (publishersweekly.com)
A newer Written Word Media survey, published June 23, 2026, collected 582 self-selected responses. It addresses current business conditions and expectations using different income tiers; it should not be silently substituted for the detailed 2025 results below. (writtenwordmedia.com)
US self-published title output
Publishers Weekly reported Bowker's 2025 figures on March 17, 2026. The reported self-published count rose from 2,545,885 in 2024 to 3,529,980 in 2025. Traditional output also increased, reaching 642,242 titles. (publishersweekly.com)
| Publishing route | 2025 US titles | Calculated share of combined output |
|---|---|---|
| Self-published | 3,529,980 | 84.6% |
| Traditional publishers | 642,242 | 15.4% |
| Combined | 4,172,222 | 100% |
The calculation is 3,529,980 ÷ 4,172,222 × 100 = 84.6%, rounded to one decimal place. Its denominator is the combined output in this table—not all book spending, all readers, or all books available for sale. Both publishing routes grew between 2022 and 2025, so expansion in one does not establish contraction in the other. (publishersweekly.com)
Why title counts are not sales data
An ISBN identifies a book product; it does not record a purchase. Amazon’s ISBN documentation confirms that paperback and hardcover formats need separate identifiers, while Kindle ebooks can be published without an ISBN. An ISBN-based total therefore cannot stand in for unique works, paid units, or participating authors. (kdp.amazon.com)
- Works: the underlying stories or texts.
- Products: the editions and formats made available.
- Authors: the people responsible for those works.
- Sales: transactions involving copies of the products.
Imagine an author publishing two stories, each as a paperback, hardback and Kindle ebook. The print editions use four ISBNs, while the two Kindle editions use no ISBNs. That's two works and six products, but only four ISBN-bearing products. We still know nothing about how many copies readers bought.
For your own catalog, give each work a simple internal label, then list its formats and identifiers underneath. Connect sales to those products separately. You'll be able to count stories written, editions available and copies sold without mixing them together. The ISBN guide explains how to plan the identifiers when you add another edition.

How large is the self-publishing market?
A defensible market value needs a defined financial measure and coverage across the relevant channels; the title counts and author surveys used here do not supply that total. Bowker measures output, while the surveys describe their respondents’ experiences and earnings. (publishersweekly.com)
When a report puts a dollar value on self-publishing, check what the money represents. Reader spending, author royalties and payments to publishing services are different measures. Adding them can count the same money repeatedly: a reader buys a book, the author receives a royalty and then spends part of it on editing.
Look for the year, country, formats, selling channels and revenue definition behind a market estimate. A forecast also needs a starting value and an explanation of its growth assumptions. A precise future dollar figure is less useful than it looks if those details are missing. Use title output to understand production and author surveys to explore earnings, while keeping their purposes separate.
Author income in the Written Word Media survey
The 2025 Written Word Media Indie Author Survey received 1,346 responses worldwide. Its audience leans toward commercially focused, prolific indie authors, and the figures are self-reported. The sample also includes unpublished respondents, hybrid authors, and traditionally published authors; it is not a census of self-publishers or a KDP-only earnings study. (writtenwordmedia.com)
| Reported monthly book income | Share of 2025 respondents |
|---|---|
| $100 or less | 44% |
| $500 to $5,000 | 20% |
| More than $5,000 | 13% |
| More than $10,000 | 8% |
These are selected brackets from the report, not an exhaustive set of mutually exclusive categories. In particular, the 8% above $10,000 is included in the 13% above $5,000. Adding those rows would count the highest earners twice. (writtenwordmedia.com)
The income brackets describe the people who answered that survey at that time. They don't show how quickly a beginner will reach a particular income, what expenses come out of it or what happened to authors who stopped publishing. A reported monthly amount also isn't proof that the same author received twelve times that amount over a full year.
Catalogue size and income move together
Larger catalogs were associated with higher reported income in the 2025 sample: about 80% of respondents with one to three books fell below $100 monthly, while those with at least 25 books reported median monthly income around $3,000. More than 40% of the latter group reported $5,000 or more per month. (writtenwordmedia.com)
A larger catalog can go hand in hand with experience, returning readers, connected series and more practiced marketing. The survey shows an association; it doesn't show what would happen if someone handed a beginner 25 books tomorrow. Use it to ask better questions about a publishing business rather than promise a particular result.
Three authors can have the same number of titles and very different businesses. One writes a linked series, one publishes unrelated books and one has built a backlist over decades. Their readers, prices and release patterns differ. Reaching book 25 doesn't switch on an income level by itself.
Compare authors whose situations resemble yours. Note your years publishing, genres, series, release schedule, available titles and marketing spending. Then ask which survey group is closest. It won't make the sample representative of everyone, but it gives you a more useful reference than comparing a debut with a long-established catalog.

What the 2026 mid-year survey adds
Written Word Media’s June 2026 survey adds a newer snapshot of expectations: 51% of its 582 respondents expected income growth over the following twelve months. Its methodology identifies respondents as self-selected from the company’s author community, with self-reported data. (writtenwordmedia.com)
Expecting income to rise isn't the same as having received that rise. The 2026 survey also groups incomes differently, so it can't tell us directly whether the 2025 share earning $100 or less has changed. Keep the detailed 2025 earnings picture and the newer outlook side by side, with their dates clearly labeled.
ALLi’s author-income findings
The Alliance of Independent Authors 2025 data report reports a median annual gross income of US$13,500 from 1,520 qualified responses, selected from more than 1,800 submissions worldwide. Its table labels the income periods as the last year and the preceding year, with amounts normalized to US dollars. The report’s publication year should not automatically be treated as the earnings year. (allianceindependentauthors.org)
Two comparisons appear alongside that median:
- Within the latest survey: $13,500 versus $10,001 for the preceding reported year, an increase of approximately 35%.
- Between survey waves: $13,500 versus the $12,749 median in the 2023 survey, an increase of approximately 6%.
Both calculations match the report’s rounded percentages, but they answer different questions. The 35% compares two reported periods within the latest sample; the 6% compares medians from different survey waves. Neither means every participating author received that percentage increase. (allianceindependentauthors.org)
ALLi and Written Word Media surveyed different groups. Dividing an annual amount by twelve would make the units look alike, but it wouldn't make the respondents or definitions match. Before using either figure in a budget, read who qualified and decide how closely that group resembles the kind of author business you're building.
What does median author income tell you?
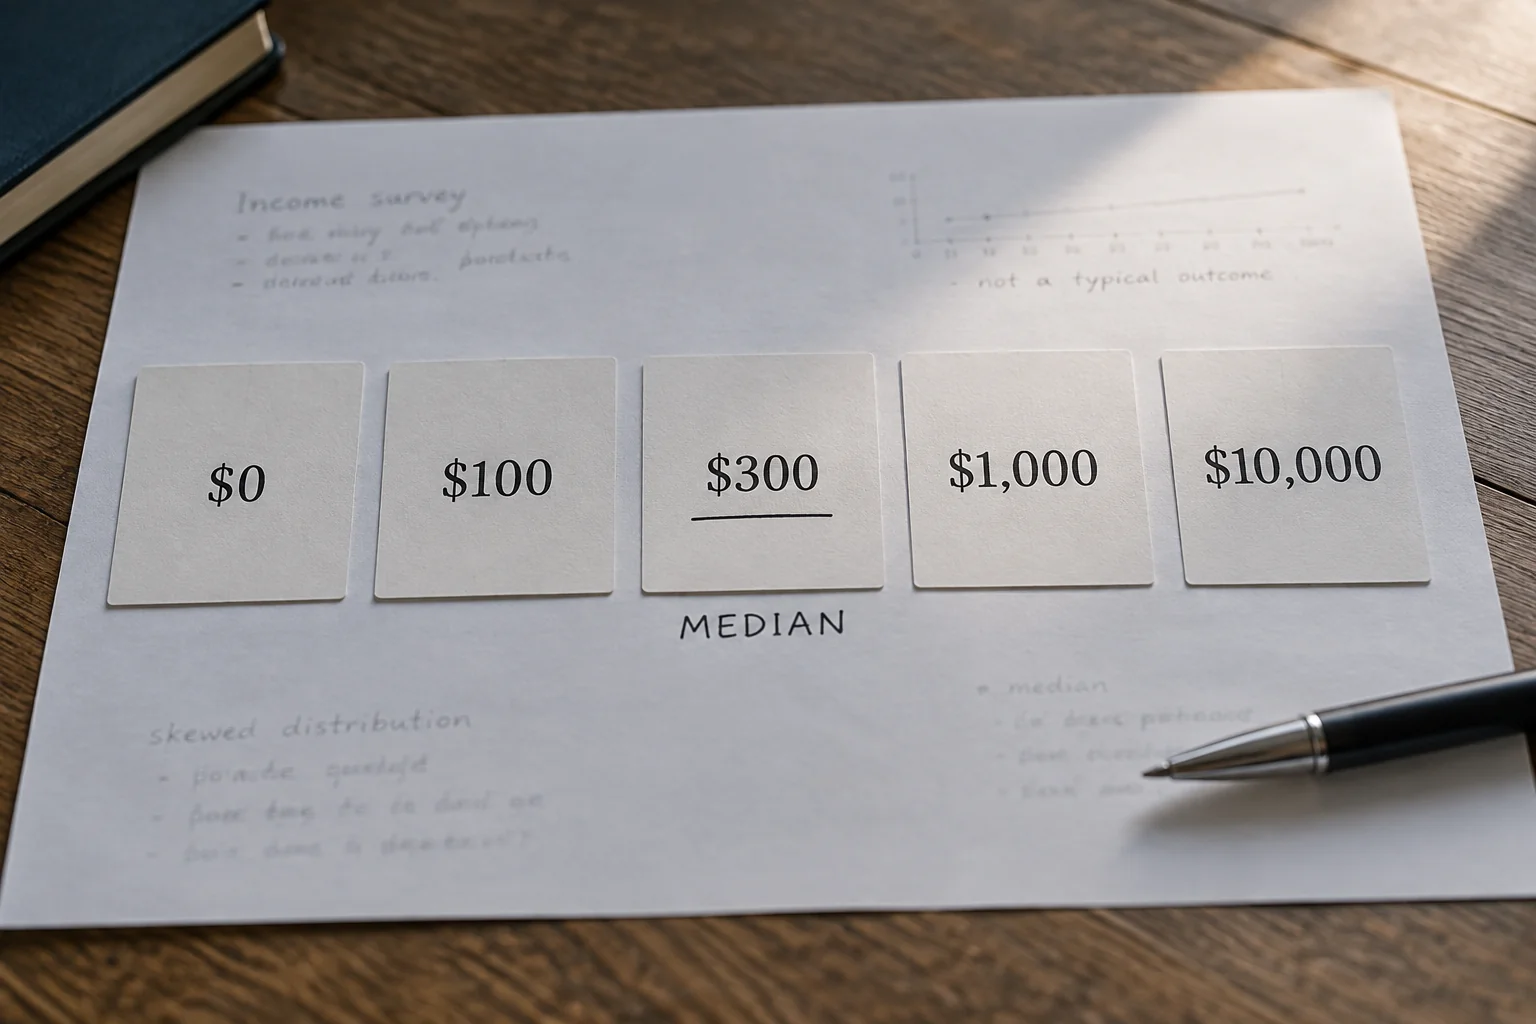
The median is the middle value when incomes are put in order. It isn't a forecast for your first book. Take this imaginary five-person list: $0, $100, $300, $1,000 and $10,000. The middle figure is $300, while the average is pulled upward by the highest earner.
- Median: $300, the middle value.
- Total: $11,400.
- Mean: $11,400 ÷ 5 = $2,280.
The mean is higher than what four of the five people earned. That doesn't make the calculation wrong; it divides the total equally across the group. The median describes the middle instead. Both still depend on who is included and what “income” means, so check those details before treating either as a normal result for a new author.
Gross income also isn't take-home profit. Suppose an author receives $18,000, spends $6,000 on production, $3,000 on marketing and $1,000 on other business costs. That leaves $8,000 before tax and payment for the author's own labor. This example shows the subtraction, rather than estimating the profits of the people in ALLi's survey.
In your own records, track both the book's total result and the money available each month. Editing may be paid before launch, with royalties arriving much later. A project can look profitable over its lifetime while leaving you short of cash during production. Neither view is captured fully by a gross-income headline.
Amazon, KDP Select, and wide publishing
Amazon ranked first for book revenue among 83% of Written Word Media’s 2025 respondents, compared with 87% in its 2024 survey and 91% in 2023. Those percentages count authors naming a leading channel; they do not measure Amazon’s share of all book revenue. (writtenwordmedia.com)
For one author, Amazon might supply 40% of receipts, ahead of stores supplying 35% and 25%. Another might earn everything through Amazon. Both name it their leading channel. Counting those answers tells us how often Amazon ranks first, but not its share of the combined dollars those authors earned.
The same respondents reported these approaches to KDP Select. Read the percentages as choices made by that survey group, rather than instructions for every author:
- 38% enrolled their whole catalog.
- 30% enrolled none of their books, described by the survey as fully wide.
- The remainder combined enrolled and non-enrolled titles.
Among respondents earning more than $5,000 monthly, 43% had all their books enrolled and 15% had none enrolled. These are distributions within a higher-income subgroup, not the probability of reaching that income by choosing either route. (writtenwordmedia.com)
For the actual publishing decision, distinguish KDP from its optional Select program. Select operates in 90-day terms for Kindle ebooks. Amazon’s enrollment guidance permits distribution through KDP and public libraries during enrollment, while print, audio, and other formats can remain available elsewhere. Enrollment renews automatically unless renewal is disabled. (kdp.amazon.com)
Compare the actual options for each title: KU reading, ebook sales on other stores, direct sales, promotion tools and the time needed to manage them. Note the end of any enrollment before changing distribution. The Kindle Unlimited payout guide helps with the royalty calculation. A popular route in a survey still needs to make sense for your book and audience.
Formats used by surveyed indie authors
Ebooks and paperbacks were the most commonly offered formats in Written Word Media’s 2025 sample. The figures below concern authors’ available products, not readers’ purchases. (writtenwordmedia.com)
| Format offered | Share of 2025 respondents |
|---|---|
| Ebook | 98% |
| Paperback | 97% |
| At least one audiobook | 51% |
| Hardcover | 36% |
| Collector’s edition | 8% |
Respondents can appear in several rows, so the percentages are not supposed to total 100%. Offering one audiobook also does not mean an author has converted the entire catalog or earns a substantial share of revenue from audio. (writtenwordmedia.com)
Give each new format a job. A hardback for signed events, an audiobook for existing listeners and a collector's edition for fans need different budgets. List preparation costs, what each sale leaves you, ongoing work and signs of reader interest. The percentage of other authors offering audio tells you about adoption, not how many people will buy your audiobook.
Why authors said they publish
Making money was the primary motivation for 40% of Written Word Media’s 2025 respondents. Other responses were telling their story, 20%; becoming well known, 16%; enjoying writing as a hobby, 15%; and other reasons, 9%. (writtenwordmedia.com)
A family history can succeed with a small circle of readers. A commercial series may need to recover its production budget and fund the next release. Those projects shouldn't be judged by the same income threshold. The range of motivations in the survey is a reminder to decide what success means for your book before comparing yourself with other authors.
Write down a concrete aim: finish and distribute the book, reach a particular audience, recover a budget or earn an amount after costs within a stated period. Then choose numbers that help you assess that aim. Publishing a book and building a sustainable income are both worthwhile goals, but they need different measures.
Direct sales and email lists
About 30% of Written Word Media’s 2025 respondents already sold through their own website or store. Among those not doing so, about 30% planned to start within twelve months. Roughly half of respondents in the $10,000-plus monthly income group sold direct. (writtenwordmedia.com)
The second 30% applies only to respondents who weren't already selling direct. It's also a plan for the future. Don't add it to the current participation figure and call the result today's adoption rate. Keep the people already doing something separate from the people who hope to try it.
Email-list ownership showed another association. Among published respondents, median monthly book income was approximately $300 with a list and $15 without one. Average list size ranged from 902 subscribers in the under-$100 income group to 18,327 in the over-$10,000 group. (writtenwordmedia.com)
A newsletter or store may support sales, but these comparisons don't isolate its effect. An established readership can help explain both a larger list and higher income. The survey doesn't show what each author would have earned without those tools. Treat the findings as a reason to investigate, not a guarantee that opening a store will reproduce the result.
For a direct-sales trial, choose a clear offer, time period and spending limit. Track receipts, refunds, payment fees, fulfillment, ads and support time. Also consider whether the buyers are new or existing readers who switched stores. Money arriving through a new checkout isn't always extra income for the business overall.
For a newsletter, track delivered messages, engagement and purchases separately from subscriber count. Use a consistent way to connect a sale to the campaign, such as a link or offer code. The useful question is whether the activity helps your goal at a sensible cost, rather than whether your list is as large as a high-earning respondent's.
What this means when choosing a publishing route
These datasets cannot establish which route will earn more for an otherwise identical new book: the output table counts publishing products, while the surveys measure selected authors. They do not provide a controlled comparison of equivalent debut projects. (publishersweekly.com)
Start with the choices actually available to you. How much control do you want over timing and packaging? Which formats do readers need? How will you reach them, and how much marketing do you want to handle? Compare the terms, costs and responsibilities attached to each route instead of asking one industry statistic to choose for you.
Use the same time period when comparing routes. Show which costs you pay, which payments are guaranteed and which receipts are estimates. Include your production and promotion time too. Survey figures can provide context, but they can't supply the missing terms of a publishing offer or prove demand for a book that hasn't launched.
Sources and downloadable data
| Source | Evidence used | Main limitation |
|---|---|---|
| Bowker table published by Publishers Weekly, March 17, 2026 | US 2025 title output and earlier-year comparisons | ISBN-bearing products; not copies sold or unique authors |
| Written Word Media 2025 survey | Income brackets, catalogs, channels, formats, motivations, direct sales, and email | 1,346 worldwide self-reported responses from a commercially skewed audience |
| Written Word Media June 2026 survey | Newer income-growth expectations and methodological context | 582 self-selected respondents; different income tiers; expectations are not outcomes |
| ALLi 2025 data report | 1,520 qualified responses; annual gross median and two growth comparisons | Screened, self-reported sample; income-period labels require care |
| Amazon KDP documentation | ISBN requirements and Select enrollment rules | Platform-specific rules, not industry income evidence |
The source publications and platform documentation support different kinds of claims; none should be used outside its stated scope. (publishersweekly.com)
Download the methodology ledger (CSV) to keep the figures and their definitions together. It records values, units, countries, periods, samples and calculations. When reusing a statistic, carry those details with it and keep forecasts separate from reported results. The best benchmark is one that answers your question about your publishing plan without changing what the original number measured.